
MGH Products · MetaTrader 4
MGH-CrossAlert Histogram
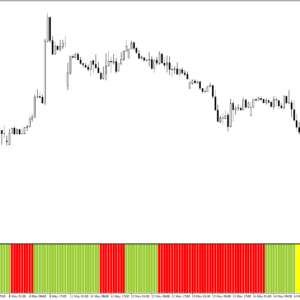
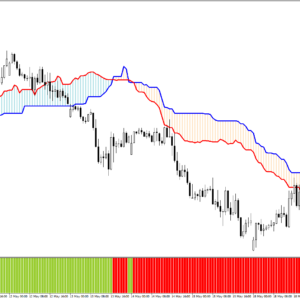
Stop watching two lines overlap on a crowded chart. See the relationship between any two lines as a continuous, color-coded histogram — direction, strength, and crossover timing, all in one clean sub-window.
Most traders monitor two lines on a price chart and wait for them to cross. MGH-CrossAlert Histogram takes a fundamentally different approach. Instead of overlapping lines fighting for space on the price chart, it gives you a dedicated sub-window histogram that answers three questions simultaneously on every single candle: which line is dominant right now, how strong is that dominance, and exactly when does the balance of power shift. No clutter. No ambiguity. Just clean, actionable visual information at a glance.
Built on the same core engine as the CrossAlert Cloudy indicator, the Histogram version is purpose-designed for traders who want a clean price chart and a structured analytical sub-window rather than visual overlays directly on price.
🟢 Green. 🔴 Red. 🟡 Yellow. That’s All You Need.
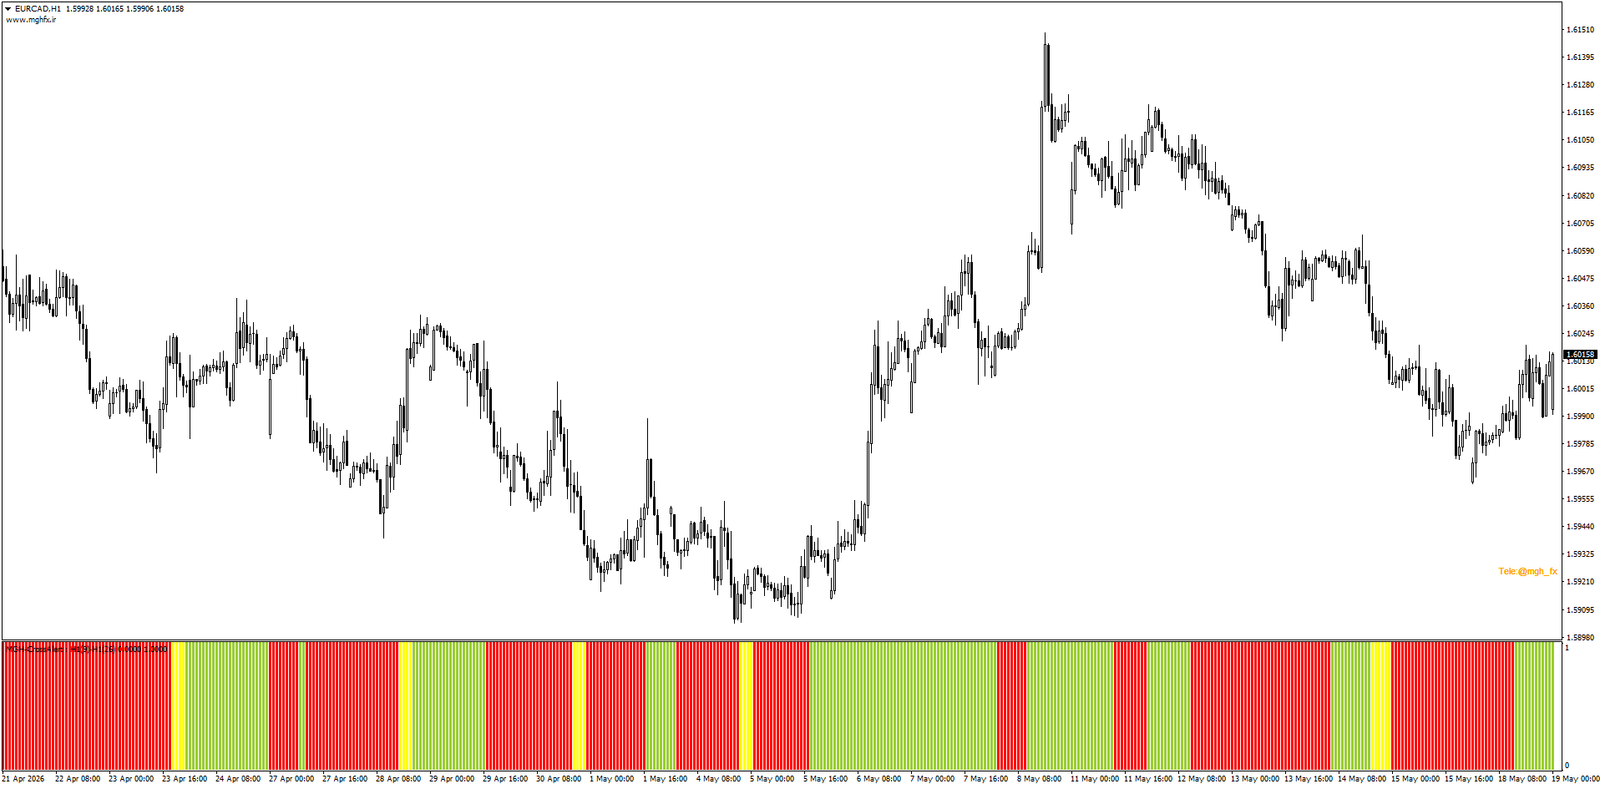
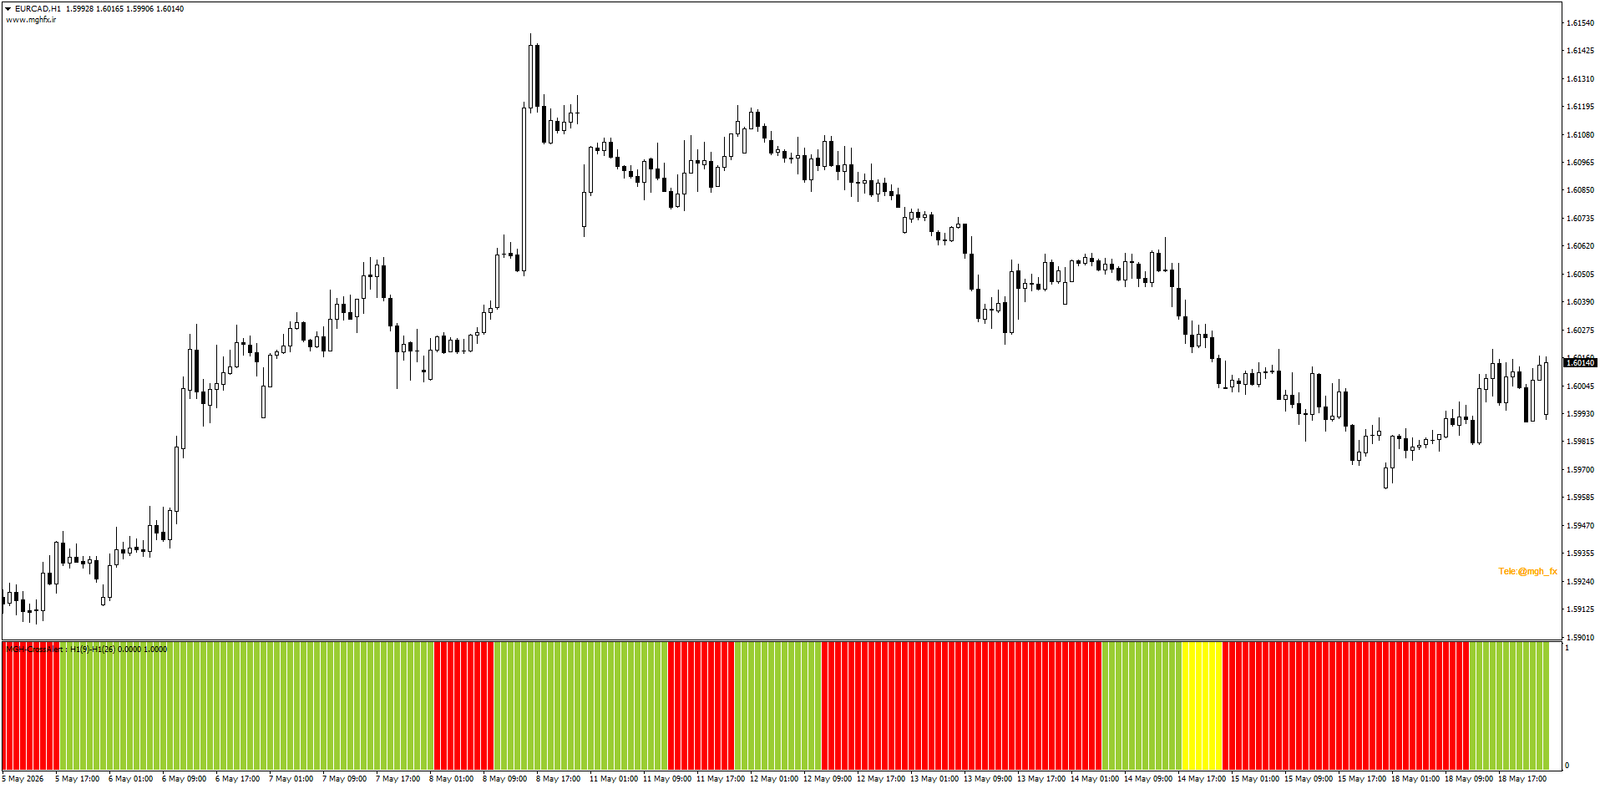
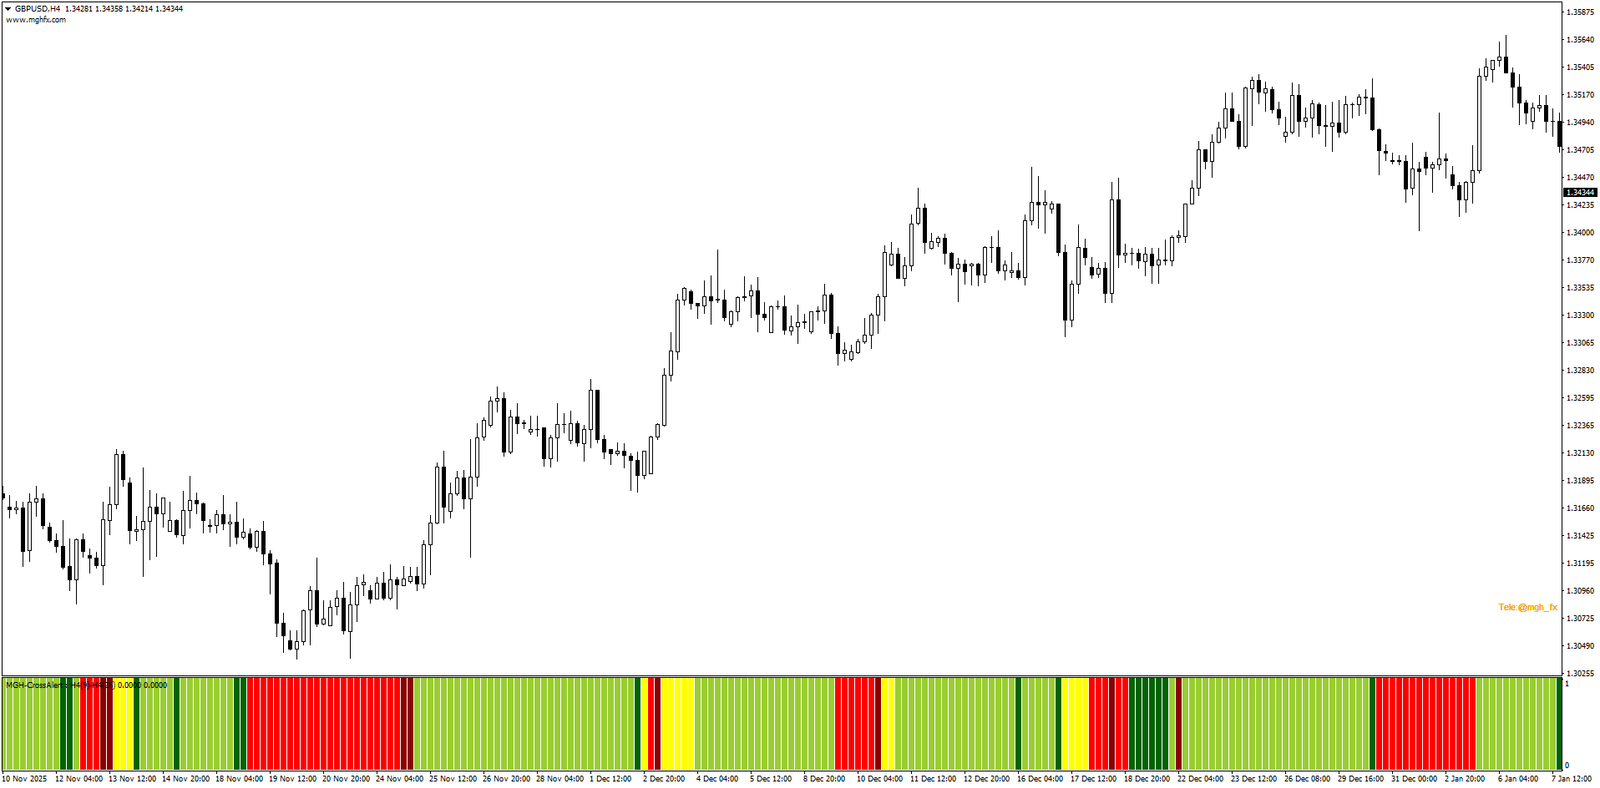
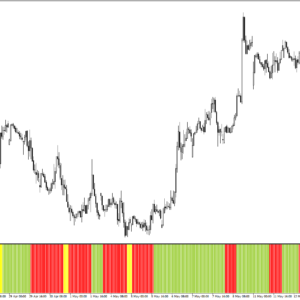
The color logic of MGH-CrossAlert Histogram is designed to be read instantly — no conscious analysis required. A single glance at the sub-window tells you everything about the current relationship between your two selected lines:
Green — Bullish StructureLine 1 is above Line 2. The dominant line is in control. Bullish bias is active and confirmed on this candle.
Red — Bearish StructureLine 2 is above Line 1. The balance has shifted. Bearish bias is in effect — proceed accordingly.
Yellow — Crossover NowThe two lines are equal. A crossover is occurring on this exact candle — the turning point is happening right now.
Every bar on the histogram reflects the live relationship between your two selected lines. The moment the color changes, the balance of power has shifted — and you see it immediately, with complete clarity, without hunting for an intersection point on a busy chart.
⚡ Professional Histogram Mode — See Strength, Not Just Direction
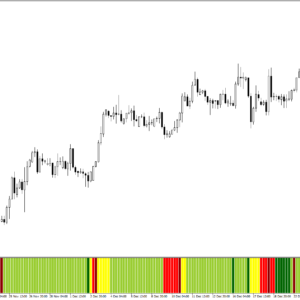
Knowing whether Line 1 is above or below Line 2 is useful. Knowing whether that relationship is growing stronger or fading is the edge that separates reactive traders from proactive ones. Activate Professional Histogram mode and the indicator adds a second layer of intelligence to every bar it draws.
⚡ Professional Mode — How It Works
In Professional mode, each bar is rendered in one of two shades based on whether the gap between the two lines is expanding or contracting.
Bright ColorThe gap between the two lines is widening. Momentum is building, the trend is strengthening, and the dominant line is pulling further ahead. High-conviction signal.
Darker ShadeThe gap is narrowing. Momentum is fading, the dominant line is losing its advantage. A crossover may be approaching — act with caution or prepare early.
This lets you distinguish between a strong, expanding trend and a weak, exhausted one — often before the actual crossover happens. You are no longer just reading direction; you are reading the conviction behind it.
⚙️ Full Line Flexibility — The Same Powerful Engine
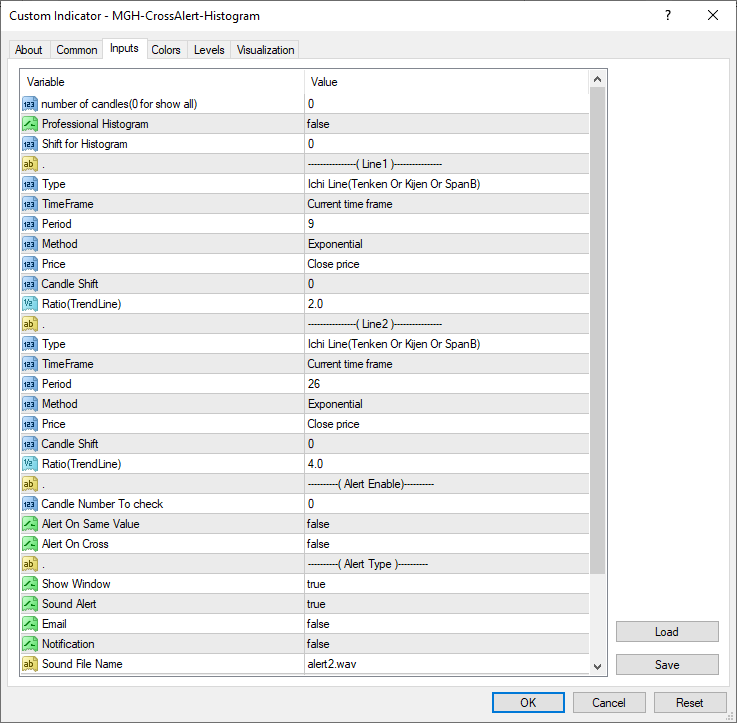
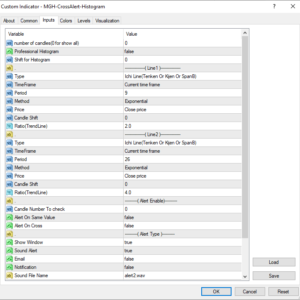
MGH-CrossAlert Histogram is built on exactly the same core engine as the CrossAlert Cloudy indicator. Every aspect of both lines is independently configurable — line type, timeframe, MA method, shift, and more:
| Parameter | Available Options |
|---|---|
| Line Types | Ichimoku lines (Tenkan, Kijun, Span A, Span B, Chikou), any Moving Average, Trend Line, or raw Price |
| Timeframe per Line | Each line references its own independent timeframe — monitor H1 Tenkan against H4 Kijun on the same chart |
| MA Methods | Simple (SMA), Exponential (EMA), Smoothed (SMMA), Linear Weighted (LWMA) |
| Shift Support | Apply candle-level shifts to either line for advanced structures like Tenkan+17 |
| Histogram Shift | Shift the entire histogram forward or backward in the sub-window for alignment purposes |
| Auto TF Multiplier | Auto 2× through 5× — automatically adapts the timeframe based on your current chart period |
🔔 Alert System — Get Called Back When It Matters
The histogram is not just a visual tool. The same alert engine from the CrossAlert Cloudy indicator is fully embedded. Walk away from the screen and be notified the moment a key event occurs:
Alert On CrossFires when the histogram color changes from green to red or red to green — the fundamental crossover event.
Alert On EqualityFires on the yellow bar — the precise equilibrium moment between your two selected lines.
Candle ControlSet to 0 for live candle alerts, or 1 for confirmed closed-candle signals — no false alerts from repainting.
All Delivery MethodsOn-screen popup, sound alert (.wav), email notification, and push to mobile — all independently configurable.
📊 Practical Use Cases
MGH-CrossAlert Histogram was built to replace the tedious task of watching two overlapping lines and waiting for them to meet. Here is how traders are putting it to work:
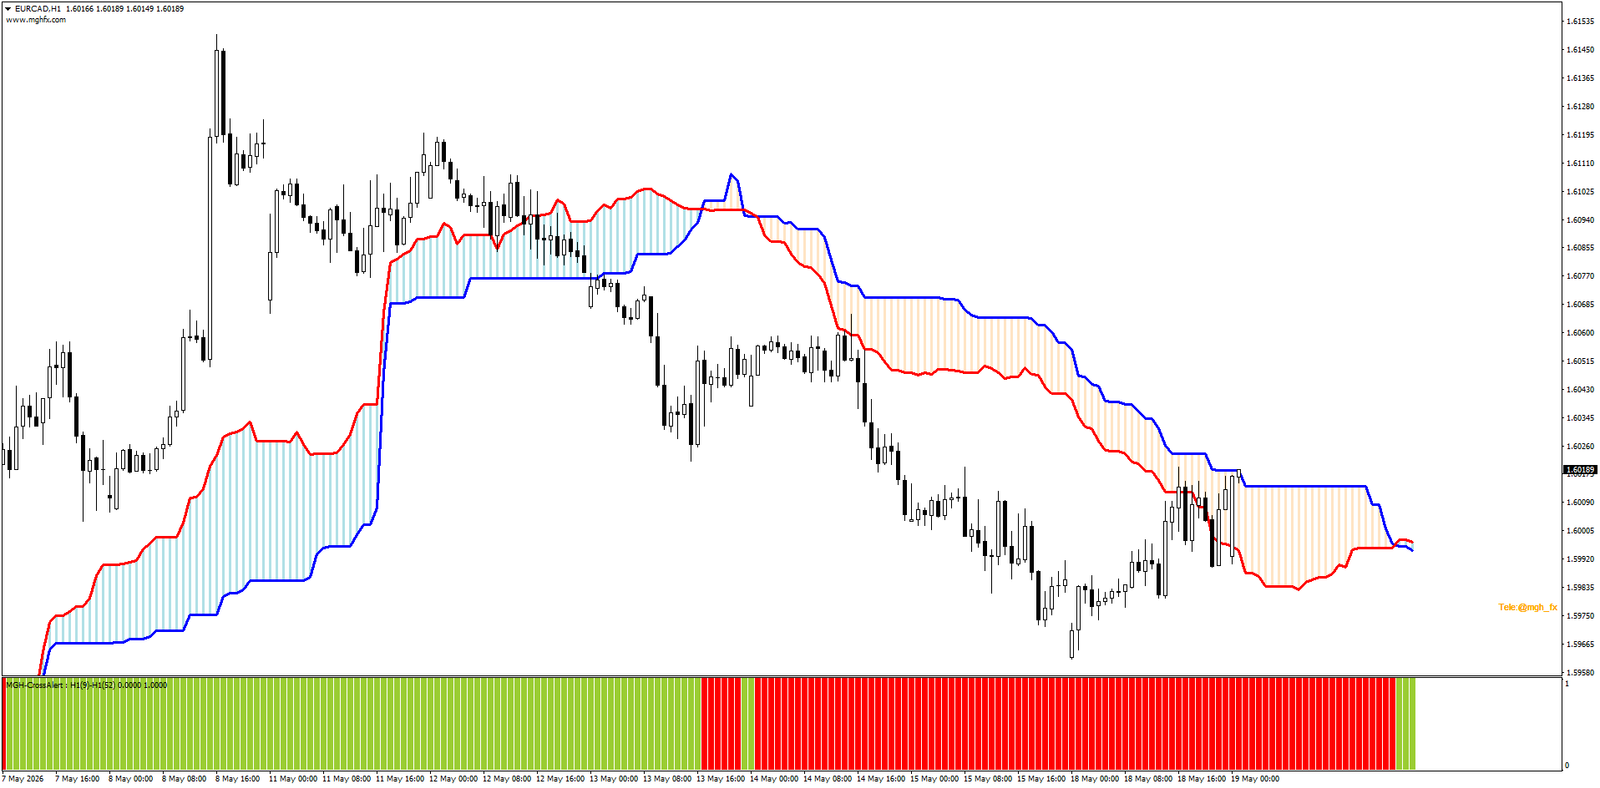
- Tenkan vs Kijun histogram — see every TK cross and its strength as a clean color-coded sub-window, without overlapping lines cluttering your price chart. Green means up; red means down; yellow means it’s turning — the whole Ichimoku story in one bar.
- Kumo cloud direction dashboard — monitor Span A vs Span B dominance bar by bar. Know at a glance whether the Ichimoku cloud is bullish or bearish at any given moment, even across higher timeframes.
- Multi-timeframe MA crossover tracking — set Line 1 to H4 SMA 50 and Line 2 to H1 EMA 9, and watch their relationship evolve in real time on any chart you are actively trading.
- Price vs Moving Average position — instantly see whether price is above or below a key moving average on any selected timeframe, without needing to draw the MA on your chart at all.
- Professional mode momentum warning — use darkening bars to detect when a trend is losing conviction before the crossover arrives, giving you earlier exit signals and tighter risk management.
- Chikou Span relationship monitoring — track how the Chikou Span relates to another Ichimoku component or price across timeframes — one of the most complex Ichimoku signals made visually simple.
⭐ Feature Summary
📊
Sub-Window Histogram
Dedicated sub-window display keeps your price chart completely clean while showing the full line relationship story bar by bar — direction, strength, and crossover all in one view.
🎨
3-Color Signal Logic
Green, Red, Yellow — instant visual readout of dominance, reversal, and crossover with zero ambiguity or interpretation needed. Readable at a glance from across the room.
⚡
Professional Mode
Bright/dark dual-shade bars reveal whether momentum behind the dominant line is expanding or contracting — often signaling the coming crossover before it actually happens.
🕰️
Per-Line Timeframes
Each line carries its own independent timeframe, including Auto 2×–5× multipliers that adapt automatically to your current chart period for true multi-timeframe analysis.
🔔
Built-In Alert Engine
Cross and equality alerts with live or closed-candle confirmation, delivered via popup, sound, email, or push notification to mobile — all independently configurable.
🔗
MT5 Version Available
A MetaTrader 5 compatible version with the full identical feature set is available separately on MQL5 Market — same engine, same logic, natively compiled for MT5.
🛠️ Setup in Under Two Minutes
No scripts to configure, no external libraries to install, and no chart modifications required beyond attaching the indicator to your chart.
- Select Line 1 type — Moving Average, any Ichimoku component, Trend Line, or Raw Price — and set its period, MA method, applied price, timeframe, and candle shift.
- Repeat the same process for Line 2, selecting its own independent type, period, and timeframe — they can be completely different line types.
- Enable Professional Histogram mode if you want the two-shade momentum layer — bright for expanding gaps, dark for contracting ones.
- Configure your alert conditions: on cross, on equality, or both — and choose live candle (0) or confirmed close (1) for the candle check setting.
- Select your preferred delivery methods: popup, sound, email, and/or push notification to mobile.
- Click OK. The histogram appears in a clean sub-window. Your price chart stays completely uncluttered. Works on any symbol, any timeframe.
👤 Who Is This For?
Visual TradersTraders who want trend direction at a glance without analyzing overlapping lines on a crowded price chart.
Ichimoku TradersVisualize TK crosses, Kumo dynamics, and Chikou relationships more clearly than any on-chart approach allows.
Multi-TF AnalystsA quick dashboard of higher-timeframe line relationships without switching charts or adding clutter.
Early Warning SeekersTraders who want to detect momentum fading and position for a crossover before it actually happens.
COMPANION TOOL
CrossAlert Cloudy (MT4)
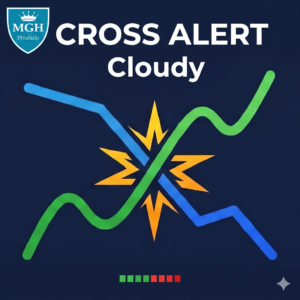
The on-chart companion version. Instead of a sub-window histogram, it draws a live color-coded cloud directly between the two lines on your price chart — giving you visual context directly on price action.
CURRENT PRODUCT
CrossAlert Histogram (MT4)
Sub-window histogram approach. Keeps the price chart completely clean while delivering a comprehensive bar-by-bar relationship analysis below your main chart. Direction. Strength. Timing. All in one color.
You are here
🔗 Looking for the MT5 version? → CrossAlert Histogram (MT5)
Direction. Strength. Timing. All in One Color.
Attach the histogram to any chart, on any symbol, and see the relationship between your two lines come alive bar by bar — before you spend a single dollar.
Free demo available on MQL5 Market · Works on any symbol and timeframe · Questions? Message me on MQL5.

Reviews
There are no reviews yet.