Pass: www.mghfx.com
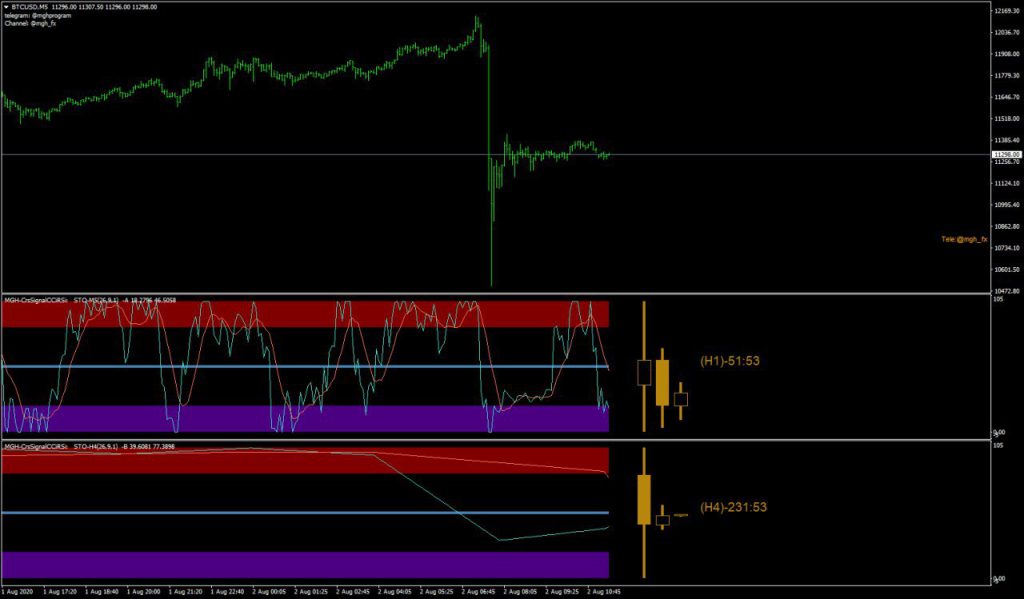
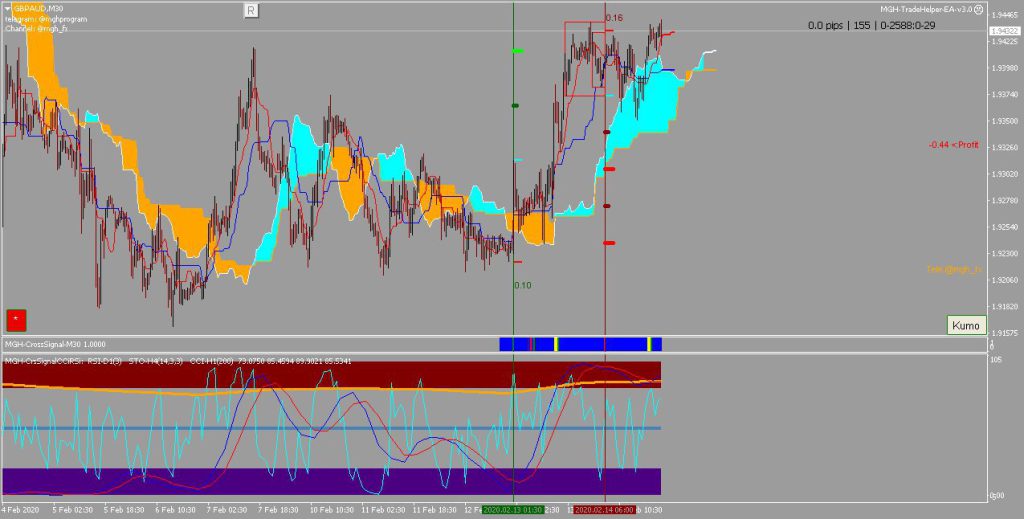
This indicator serves as a confirmation signal for the cross signal system, providing powerful support for the cross signal indicator. It is a combination of the CCI200 and RSI3 indicators.
This system is highly effective and can be used to identify successful entries with the assistance of price action principles.
Strategy:
If the CCI is above the middle line, we should buy; if it is below, we should sell. If the stock is bullish with the RSI cross, we can enter a buy position below the middle line as long as the cross does not reverse. In this case, we should set the stop below the entry candle.
Note :
If the stochastic is bullish but the blue line of the stock remains inside the oversold area, the RSI must be close to the oversold area before you can enter.
In the below conditions,, the stop should be placed below the entry candle, which means there is great risk to reward.
Facilities :
- Multiple timeframes for CCI, RSI, and Stochastic indicators.
- Ability to add multiple indicators to the chart with customizable names in the settings.
- Display of the last three candles from the higher timeframe.
- Shows the remaining time until the next candle on the higher timeframe.
- The default higher timeframe is set to four times higher, but it can be adjusted in the settings.
Indicator setting :
- RSI timeframe: Automatically adjusts to the next timeframe.
- CCI timeframe: Automatically adjusts to three times higher timeframe.
- Stochastic timeframe: Automatically adjusts to two times higher timeframe.
