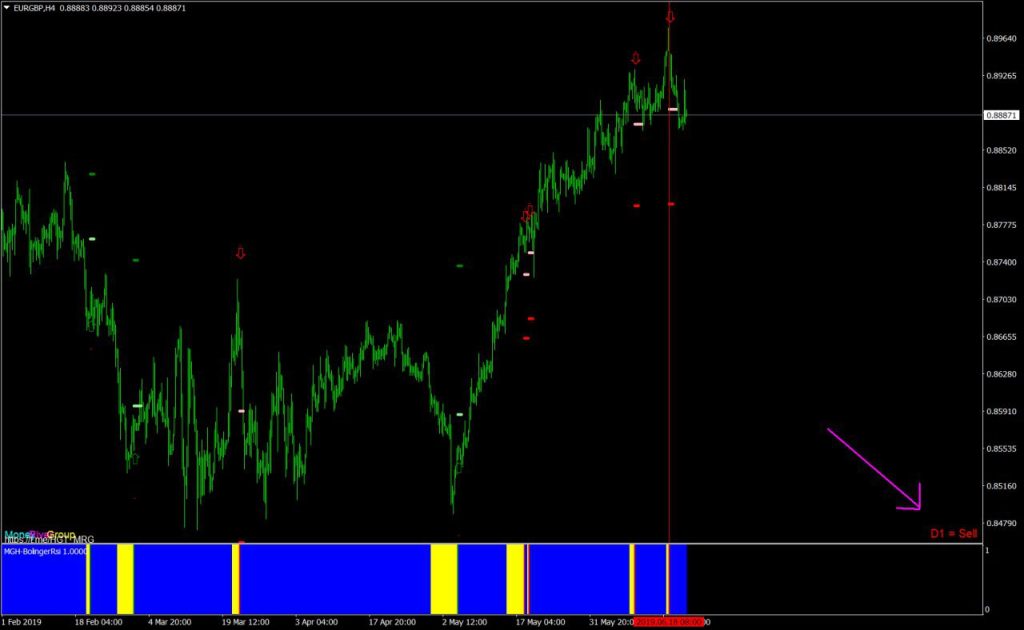
This indicator is based on Chris’ training. It’s predicting the market movement, based on 26 Kijsen’s flats and is helpful on European and American currencies in four hours.
Strategy :
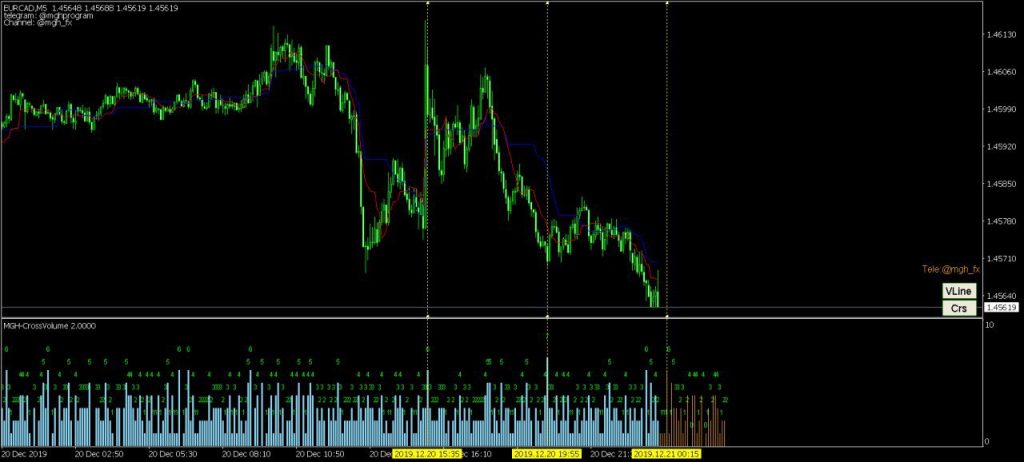
Green vertical lines show the beginning of the plateau and red one the end of the plateau, and the blue line is the prediction of movement.
Big flats get more accurate answers.
Pay attention to the places where the moving blue line is sharp and the volume of the opposite flat is high, it is very likely that the pivot will be formed in those places.
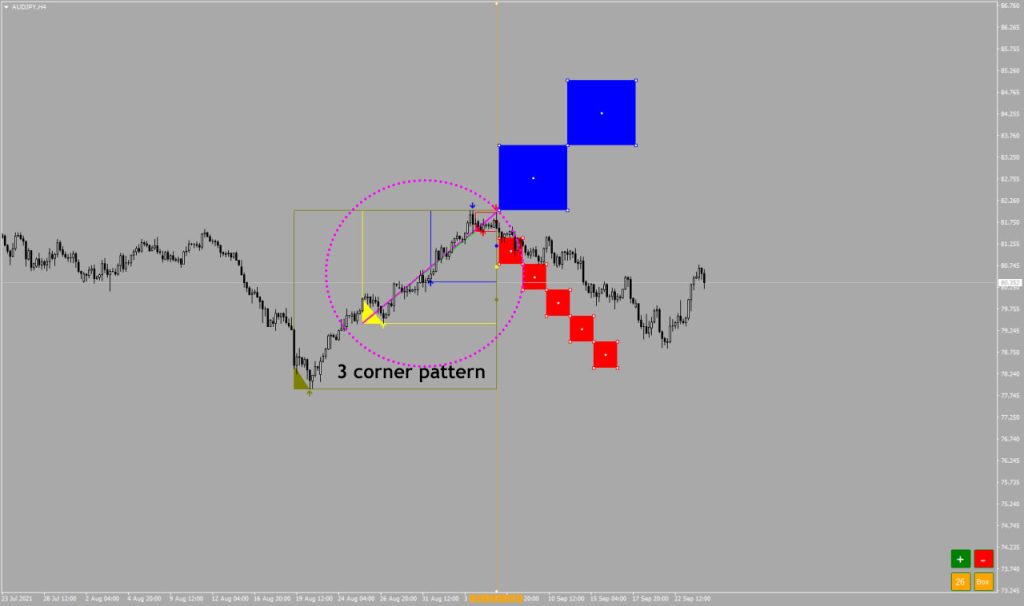
By the way, according to Chris, if the candle 52 falls on the entrance of the pattern from the beginning of the flat quality, the result will be the opposite, that is, if the blue movement shows the rise, the price will fall.