Pass: www.mghfx.com
This indicator is designed for time and price analysis. Its purpose is to display effective Fibonacci clusters, which are customizable settings. The advantage of this indicator is that it can be used with any timeframe.
Strategy :
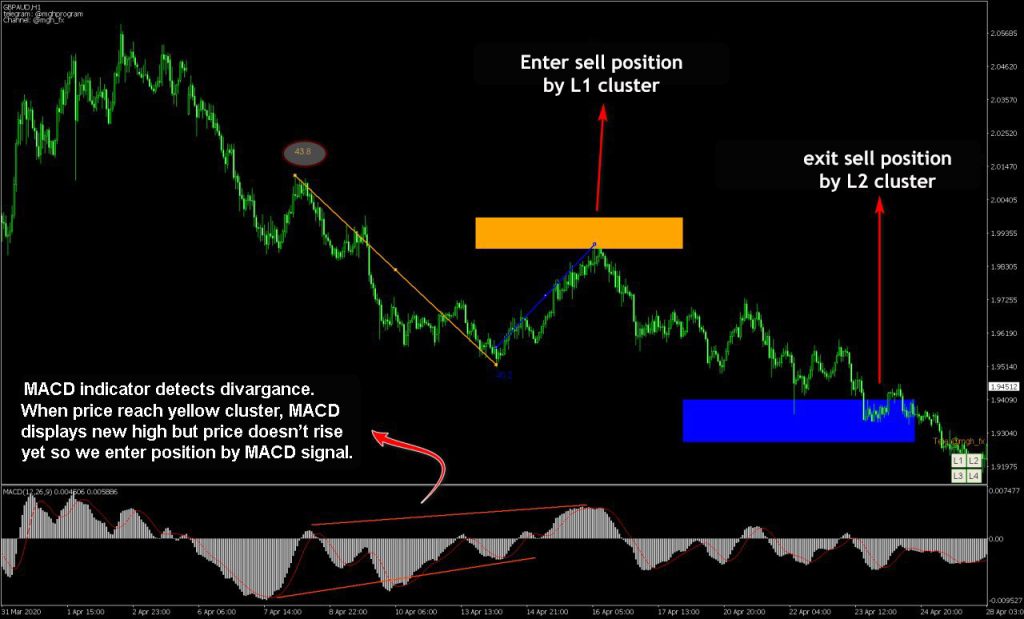
During the process, when the price corrects with MACD divergence, it reaches the orange box precisely. In this case, the MACD histogram indicates that it was able to reach the previous prices, but the current price couldn’t hit the previous price, indicating hidden divergence and a tendency to decline.
In such cases, we open a sell position with either a MACD or stochastic signal. The stop loss is placed above the orange box, and the target is set equal to the blue box.
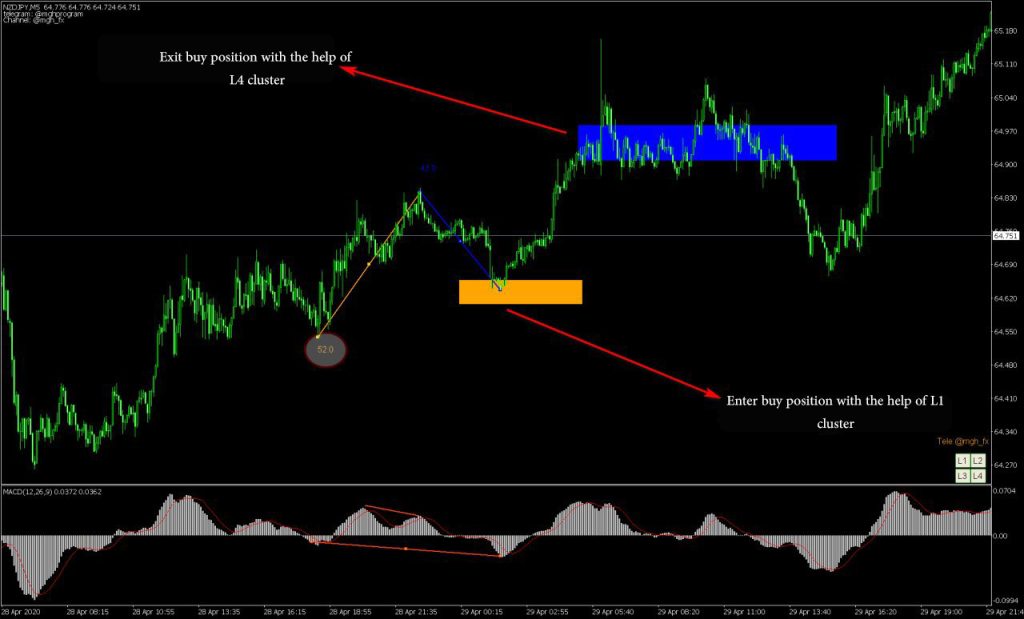
To display the yellow box, press the L1 button and move the line that appears on the chart to the right place according to the image. Doing so will automatically show the yellow box.
To view the target or exit point, use the L4 button and place the corresponding line on the modification area until the blue box appears.
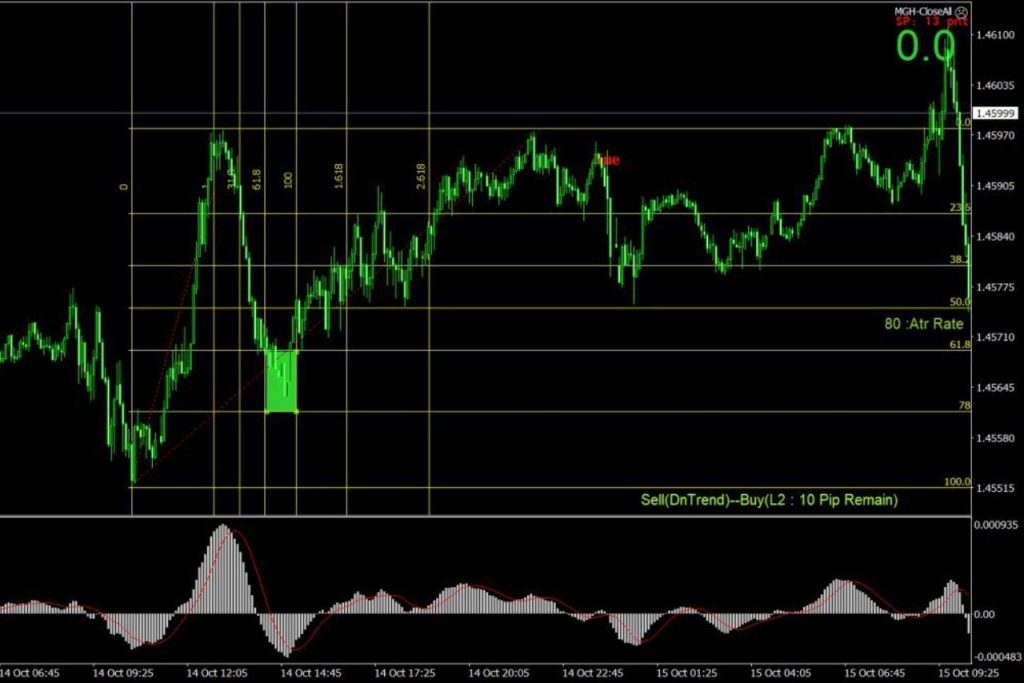
During a trend, there is a high possibility of price reversal in the fibo time of 62 to 100 and the fibo price of 62 to 78.
You will see the slope of the line as a number with a value between 0 and 90 degrees according to the following image.
- For an angle less than 53 degrees, it is better to use the L1 line.
- For an angle between 54 and 64, it is better to use the L2 line.
- Use the L3 line for the angle of 65 and more.
- The L1 line works more successfully and is better suited for longer trends.
