Notice: Function _load_textdomain_just_in_time was called incorrectly. Translation loading for the astra domain was triggered too early. This is usually an indicator for some code in the plugin or theme running too early. Translations should be loaded at the init action or later. Please see Debugging in WordPress for more information. (This message was added in version 6.7.0.) in /home/mghfxcom/public_html/wp-includes/functions.php on line 6114

Notice: Function _load_textdomain_just_in_time was called incorrectly. Translation loading for the astra domain was triggered too early. This is usually an indicator for some code in the plugin or theme running too early. Translations should be loaded at the init action or later. Please see Debugging in WordPress for more information. (This message was added in version 6.7.0.) in /home/mghfxcom/public_html/wp-includes/functions.php on line 6114

Notice: Function _load_textdomain_just_in_time was called incorrectly. Translation loading for the all-in-one-wp-security-and-firewall domain was triggered too early. This is usually an indicator for some code in the plugin or theme running too early. Translations should be loaded at the init action or later. Please see Debugging in WordPress for more information. (This message was added in version 6.7.0.) in /home/mghfxcom/public_html/wp-includes/functions.php on line 6114

Notice: Function _load_textdomain_just_in_time was called incorrectly. Translation loading for the astra-addon domain was triggered too early. This is usually an indicator for some code in the plugin or theme running too early. Translations should be loaded at the init action or later. Please see Debugging in WordPress for more information. (This message was added in version 6.7.0.) in /home/mghfxcom/public_html/wp-includes/functions.php on line 6114
MGH-MtfTrend indicator – Forex and cryptocurrency tools

MGH-MtfTrend indicator

This tool is the best for detecting trends in any system, especially when used with the popular Cross Signal indicator.

Strategy :

You can choose strategy from setting

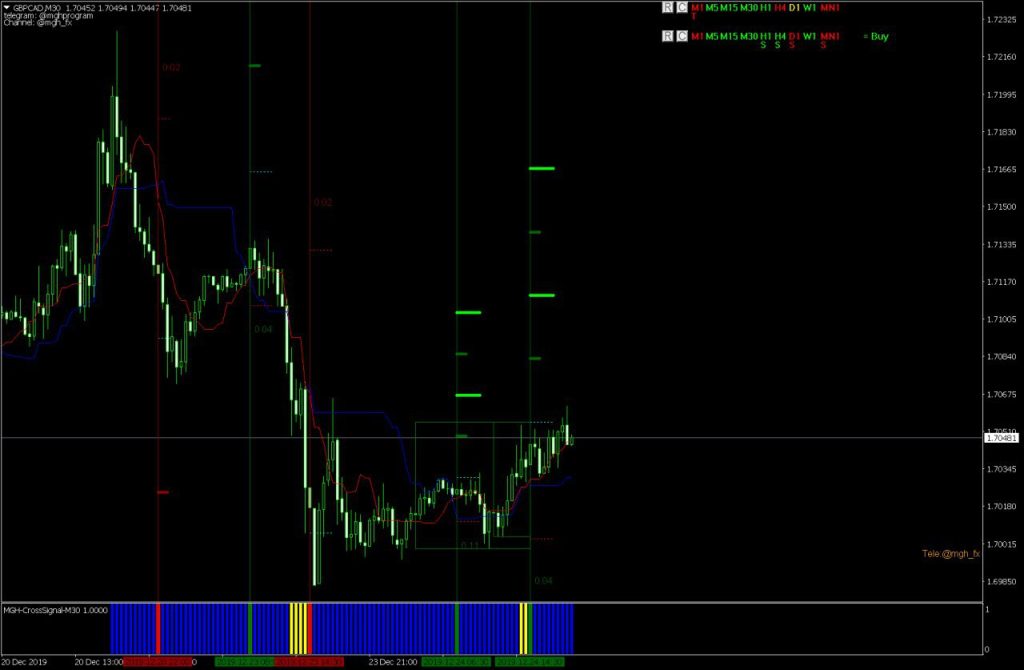
  1. Searching Tenkan-sen and Kijun-sen cross in all time frames. Red color means that the last cross is bearish, green means that the last cross is bullish, and yellow means that Tenkan-sen and Kijun-sen overlap. Note : Sometimes the letter T is written under the time frame, which means that closing the price after trigger point.
  2. Searching trends based on moving. You can specify the type of mowing from the settings. This strategy is weaker than first, but may be helpful for some strategies.

Indicator facilities :

  • You can use the indicator twice in the chart, but the second time you want to add it to the chart, you should give it a new name from the last item in settings so that there are no similarity problems.
  • The type of strategy can be changed from the settings.
  • The ‘R’ button performs the refresh operation, which has two modes:
    • Automatically at the beginning of each candle
    • Manually with the help of R button
  • Button C exits the indicator.
  • You can change the location of the indicator from the settings.
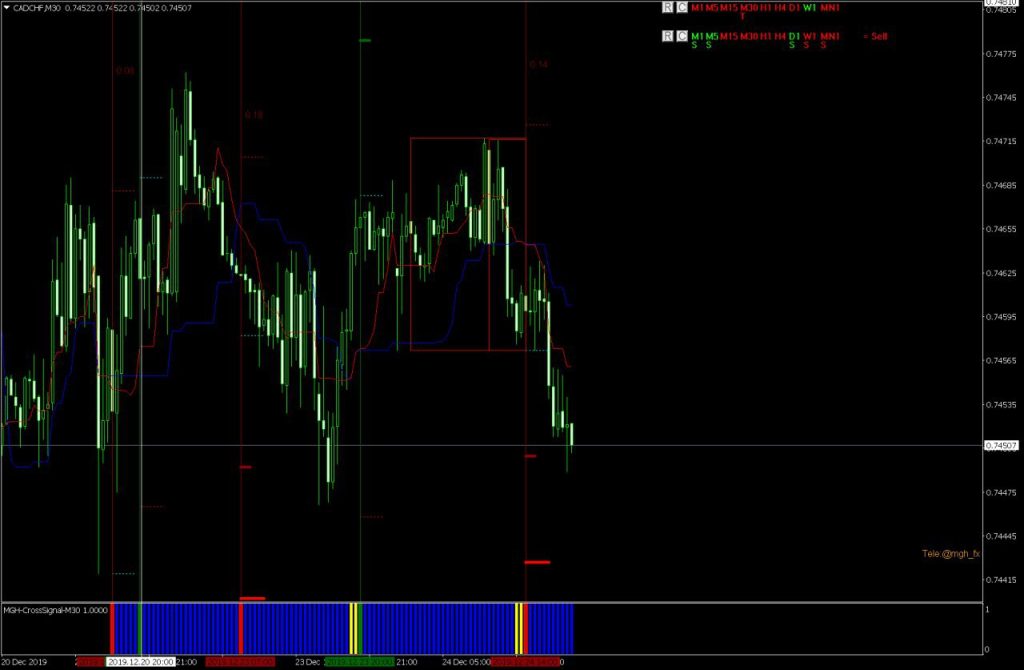
MGH-MtfTrend indicator
CADCHF,30min . M1 and M5 are positive here. In strong trends this can mean a small correction. A green M1 with S can have an impact of up to 50 candles for one minute, 10 candles for five minutes, around three candles for 15 minutes, and less than two candles for half an hour, It means that the price is expected to increase slightly and then drop again.

Signal strength indication :

  • As shown in the picture above, the indicator letter T indicates a bearish trend. All the crosses were bearish until the daily timeframe, but the price crossed the entry trigger and has since descended, giving a sell signal.
MGH-MtfTrend indicator
CADCHF,30min. all the evidence points to the ascension. H1 and H4 have S, which means we have the strength of the upward trend in these times.

Leave a Comment

Your email address will not be published. Required fields are marked *

Shopping Cart
Scroll to Top