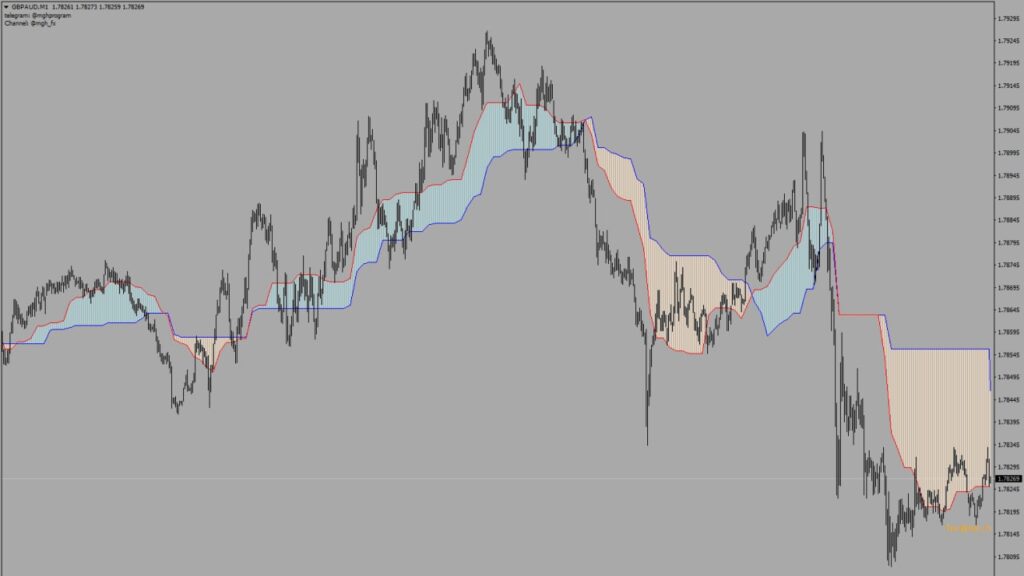
Pass: www.mghfx.com
This indicator has 2 applications :
- Showing RSI Divergence: At the peaks and when the price reaches the end of its rise or fall and starts to correct, the indicator gives a signal.
- Scalping strategy: By activating the Dual Time Frame feature and setting an alarm at either 5 or 15 minutes, you won’t miss anything, and you can easily profit 5 to 10 pips.
The default settings are the best.
Strategies :
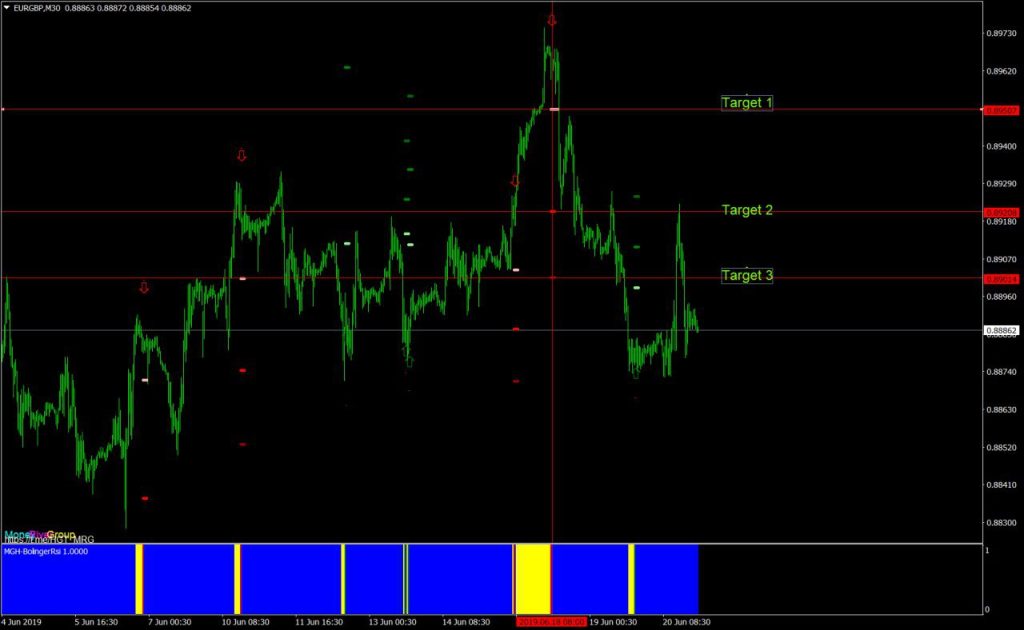
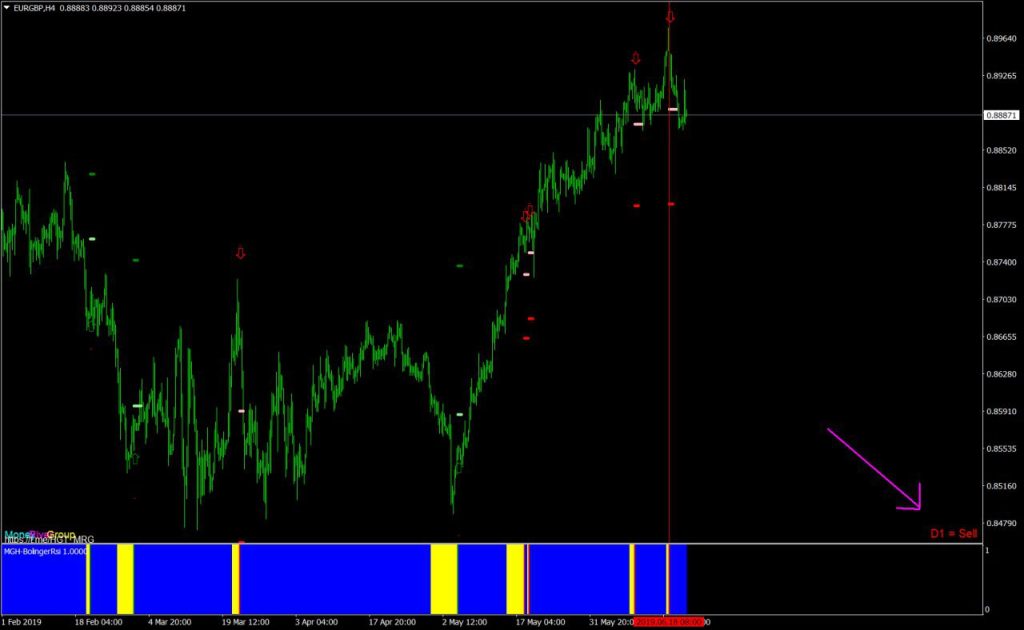
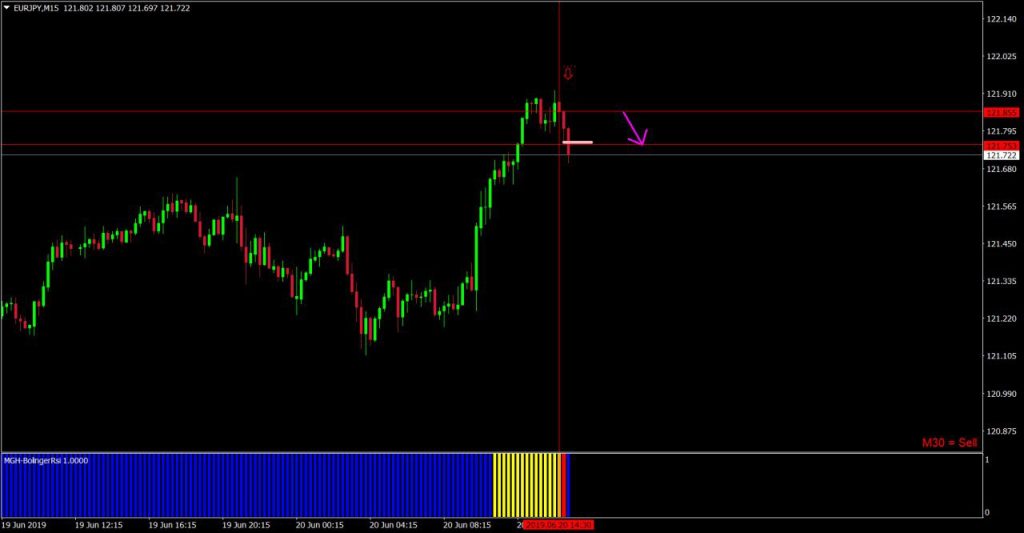
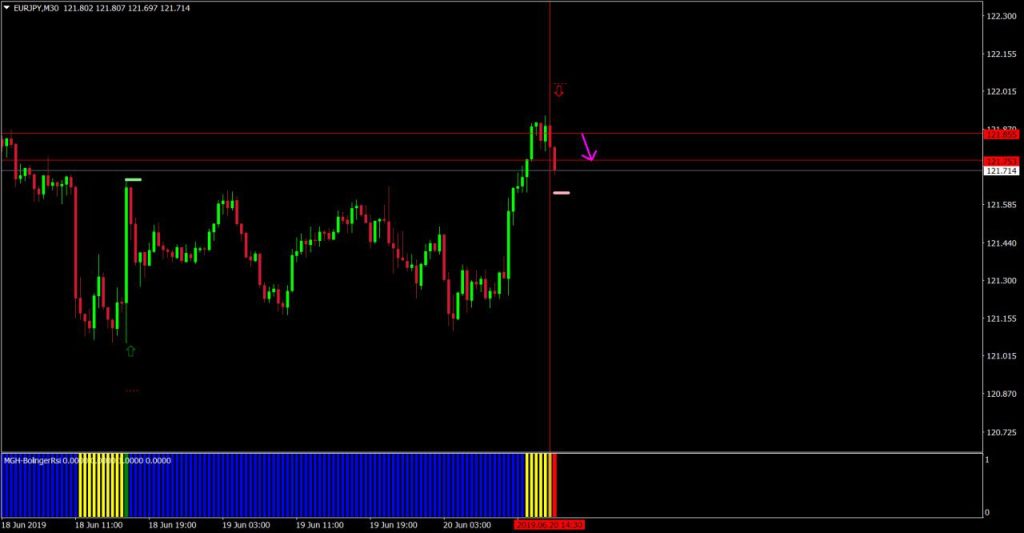
- For long-term positions and gains of 50 to 100 pips using the Bollinger indicator, we should wait for the signal of the red column on the 4-hour timeframe in the indicator window. Then, we should visit the 30-minute session and enter at the first to third points based on capital management. It is better to have the indicator in dual time mode at the 4-hour session and confirm a sell signal in the daily timeframe as shown in the picture.
- For short-term scalp trades, the signal should be available in the same range on a larger timeframe. This means that you should see the yellow warning column on the larger timeframe.
- You can determine the end of the upward movement, but the point should be confirmed on a larger timeframe. For example, if you see a trend in the 5-minute timeframe and a yellow warning column indicating the end of the rise, then visit the red signal (warning for declining price) at a longer timeframe (15 minutes in this example), which confirms the end of the trend.
