Notice: Function _load_textdomain_just_in_time was called incorrectly. Translation loading for the all-in-one-wp-security-and-firewall domain was triggered too early. This is usually an indicator for some code in the plugin or theme running too early. Translations should be loaded at the init action or later. Please see Debugging in WordPress for more information. (This message was added in version 6.7.0.) in /home/mghfxcom/public_html/wp-includes/functions.php on line 6114

Notice: Function _load_textdomain_just_in_time was called incorrectly. Translation loading for the astra-addon domain was triggered too early. This is usually an indicator for some code in the plugin or theme running too early. Translations should be loaded at the init action or later. Please see Debugging in WordPress for more information. (This message was added in version 6.7.0.) in /home/mghfxcom/public_html/wp-includes/functions.php on line 6114
MGH-Multi MACD indicator – Forex and cryptocurrency tools

MGH-Multi MACD indicator

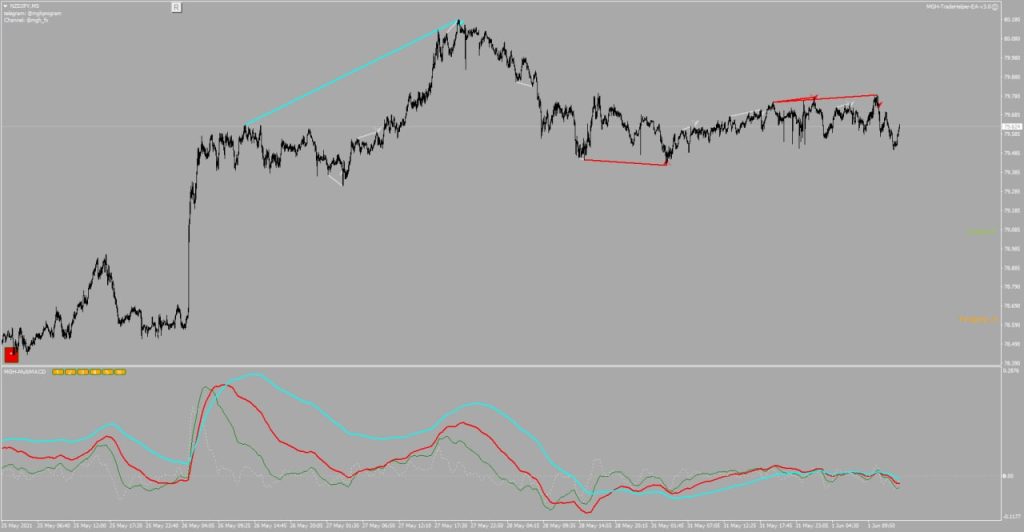
The most important feature of this version is its ability to discover and track divergence in multi-time MACD.
Features:

🔺 View MACD in the current time and up to 5 times higher at the same time (settings can be activated or deactivated).

🔺 Alert for phase changes in MACD.

🔺 An alert is triggered when the histogram line crosses the signal line.

🔺 Alert for discovering divergences.

🔺 Ability to set the desired time frame for alerts.

🔺 Possibility of activating or deactivating the MACD for each time frame using buttons.

🔺 Possibility of changing the default parameters of MACD. (To activate this feature, you must enable the corresponding item from the Divergence section of the indicator settings.)

🔺 Determine whether to look for divergence in the current time or multi-time.

Note :

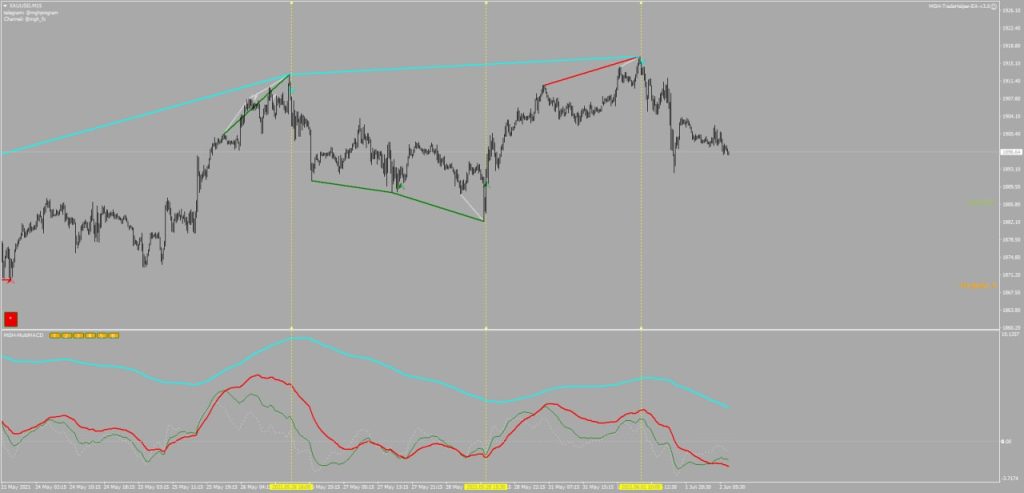
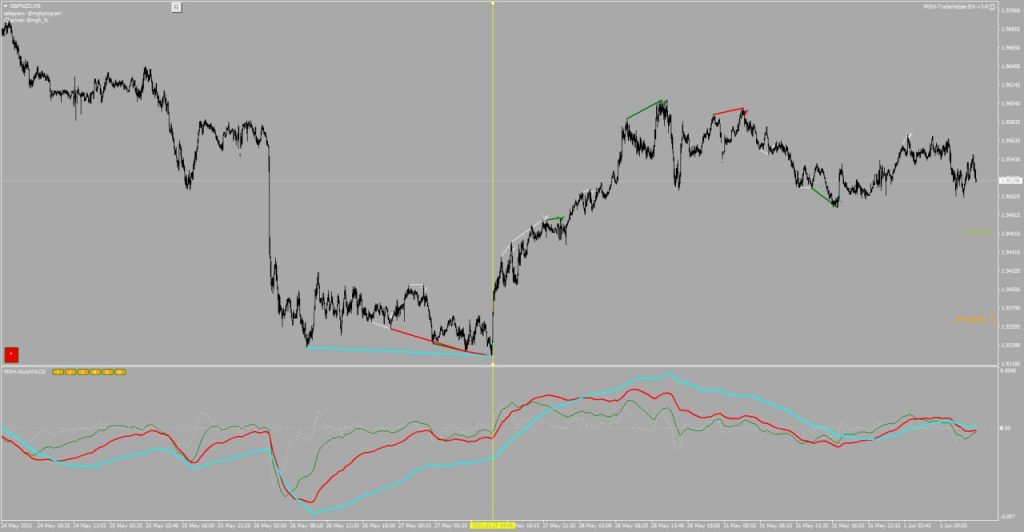
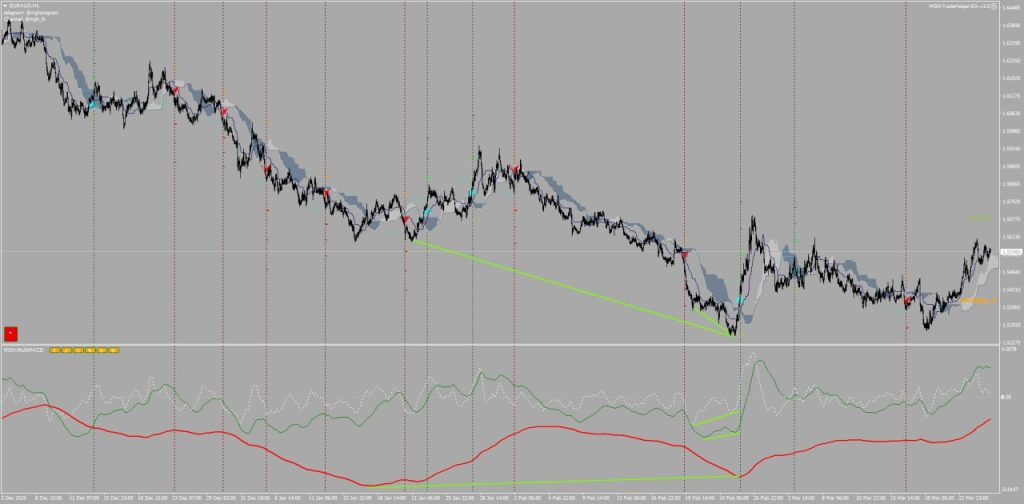
Each color of the divergence line on the chart corresponds to the MACD color in the indicator window.
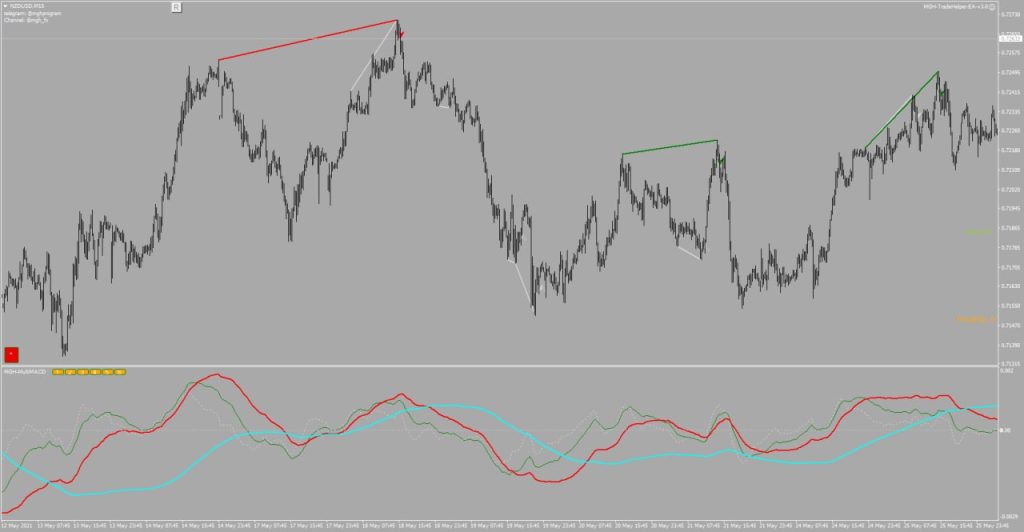
MGH-Multi MACD indicator
In this picture, we can see both the divergence in the white line (which represents the current time or 15 minutes) and the red line (which represents one hour time).
✔️If two divergences occur at the same time, it works much stronger and can bring a lot of profit.
Two important points:

🔺 This tool identifies effective divergences, but it may not detect optical divergences.

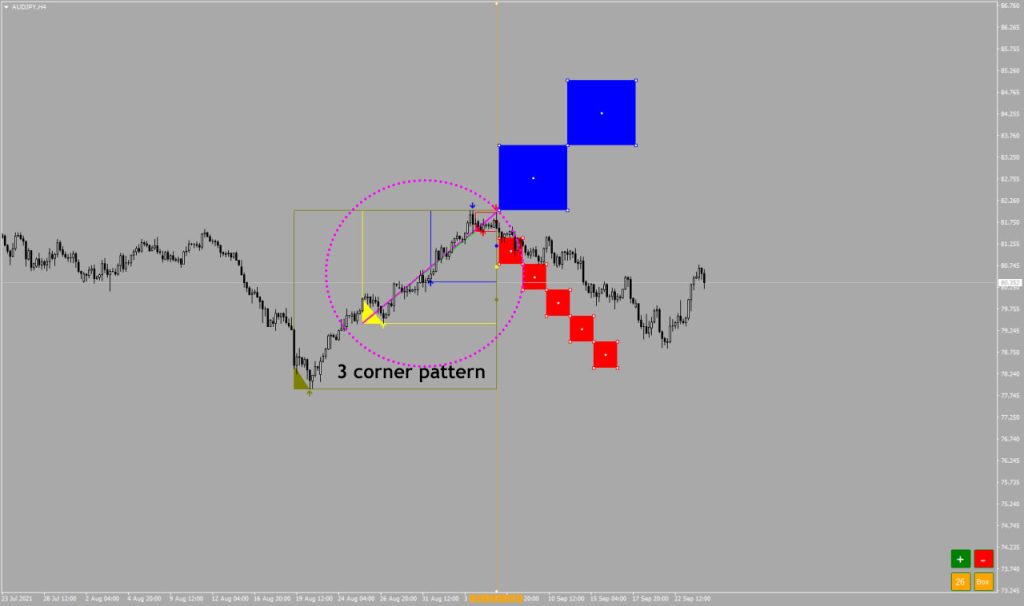
🔺 When two or more divergences occur simultaneously, they can be a strong entry strategy on their own. However, when there is only a single divergence, it can serve as confirmation for other strategies.
MGH-Multi MACD indicator

Leave a Comment

Your email address will not be published. Required fields are marked *

Shopping Cart
Scroll to Top