What Is Price Action Trading?
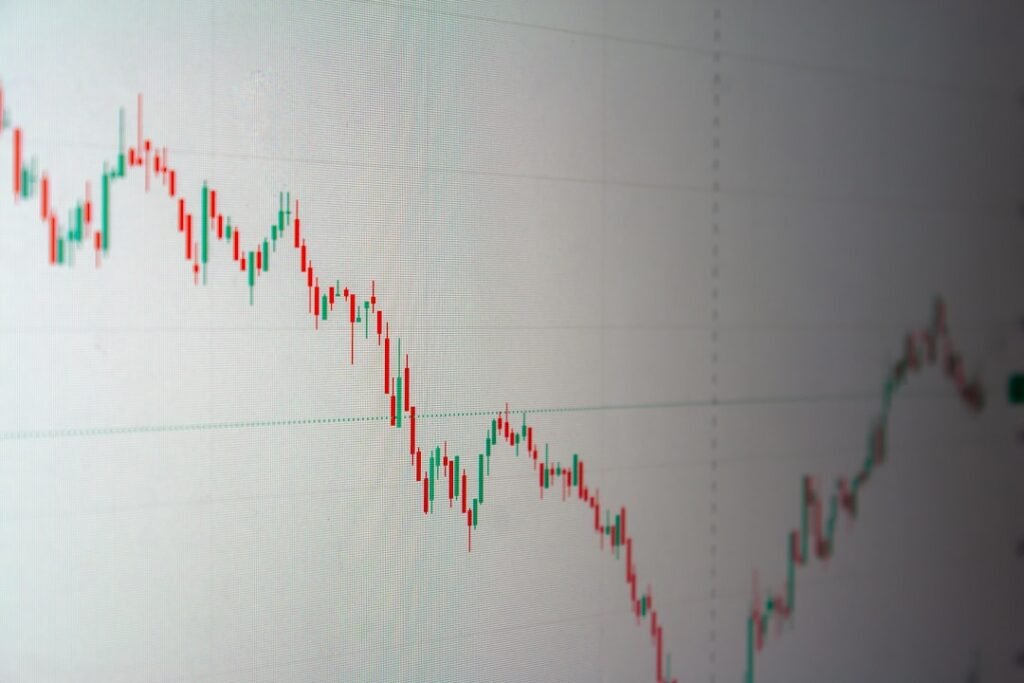
Price action trading is the practice of making trading decisions based solely on how price moves on a chart — without relying on lagging indicators like moving averages, RSI, or MACD. Instead of waiting for an indicator to signal an entry, price action traders read raw candlestick data, identify market structure, and respond to what price is actually doing in real time.
This approach is not a magic shortcut. It demands patience, a trained eye, and a solid understanding of how markets move. But for traders willing to put in the work, it offers a clean, uncluttered view of the market that many find more intuitive and responsive than indicator-heavy systems. If you’re just getting started, it helps to first be comfortable with how the forex market works before diving into chart reading techniques.
The Core Building Blocks of Price Action
Market Structure: Trends, Ranges, and Breaks
Every chart tells a story through its structure. Price moves in one of three broad states: trending upward, trending downward, or moving sideways in a range. Learning to identify which state the market is in at any given moment is the first and most important skill in price action trading.
- Uptrend: A sequence of higher highs (HH) and higher lows (HL). Each pullback finds buyers before the prior swing low, and price pushes to new highs.
- Downtrend: A sequence of lower highs (LH) and lower lows (LL). Rallies are sold into, and price consistently makes new lows.
- Range/Consolidation: Price oscillates between a defined ceiling (resistance) and a defined floor (support) without making sustained progress in either direction.
A break of market structure — for example, when price in an uptrend suddenly makes a lower low — is one of the most important signals a price action trader can observe. It may indicate a trend reversal or a significant shift in momentum. Understanding range-bound conditions is equally important; you can explore that concept further in this guide to range trading in sideways markets.
Support and Resistance: The Map of the Market
Support and resistance levels are horizontal zones where price has historically reacted — either reversing, pausing, or accelerating. They form because market participants have memory: traders who bought at a certain level and were stopped out will often sell at that same level when price returns to it, turning former support into resistance and vice versa.
To identify strong levels, look for areas where price has touched and respected a zone multiple times, or where a major move originated. The more times a level has been tested, and the more timeframes on which it appears, the more significant it is likely to be.
Key tips for working with support and resistance:
- Treat them as zones, not precise lines. Price rarely turns on the exact same pip twice.
- A level that has been broken and retested is often more reliable than one that has merely been touched.
- Higher timeframe levels (daily, weekly) carry more weight than those on lower timeframes.
Candlestick Patterns: Reading the Language of Price
Individual and multi-candle patterns convey the balance of power between buyers and sellers at specific price points. They are most meaningful when they appear at significant structural levels — a bearish reversal candle at major resistance, for example, carries far more weight than the same candle forming in the middle of nowhere.
Some of the most widely respected candlestick signals include:
- Pin Bar (Hammer / Shooting Star): A candle with a long wick and small body, showing that price was pushed strongly in one direction but rejected. A bullish pin bar at support suggests buyers overwhelmed sellers. A bearish pin bar at resistance suggests the opposite.
- Engulfing Candle: A candle whose body completely engulfs the previous candle’s body. A bullish engulfing at a support zone signals aggressive buying; a bearish engulfing at resistance signals aggressive selling.
- Inside Bar: A candle that forms entirely within the range of the prior candle, representing consolidation and compressed volatility. A breakout from an inside bar at a key level can signal the start of a directional move.
- Doji: A candle with a very small body, indicating indecision. Context is everything — a doji after a long trend move at a key level can be an early warning of exhaustion.
How to Build a Price Action Trade Setup
A disciplined price action setup requires three things to align: context, level, and signal.
- Context: What is the higher timeframe trend doing? Are you trading with the trend or fading a move? Knowing the bigger picture keeps you from taking counter-trend trades at the wrong time.
- Level: Is there a meaningful support or resistance zone nearby where price is likely to react? Without a key level, there is no logical place for price to pause or reverse.
- Signal: Has a clear candlestick pattern appeared at that level, confirming that the market is reacting as expected?
When all three elements line up — a clear trend on the higher timeframe, a significant level on the trading timeframe, and a confirming candle pattern — the setup has structural logic behind it. This is very different from entering because a chart “looks like” it might go up. For a broader framework on organizing your trading approach, the guide on how to build a trading strategy from scratch walks through the process in useful detail.
Price action works especially well during high-activity sessions when volatility and volume are genuine. The London session breakout strategy is a practical example of how session timing can be combined with structural price analysis.
Price Action vs. Indicators: Finding the Right Balance
Choosing to trade without indicators does not mean indicators are useless — it means you understand that price itself is the primary data source, and indicators are derivatives of it. Many experienced traders use a hybrid approach: they read price action first and use one or two indicators as secondary confirmation rather than as primary signals. If you’re curious about how indicators can complement rather than replace structural analysis, the article on combining indicators for stronger trade confirmation offers a practical perspective.
For traders who prefer automation or want to systematize their approach, tools like MetaTrader Expert Advisors can be programmed to act on defined price action rules. MGH Products at mghfx.com offers MetaTrader indicators and EAs that can be used alongside or in complement to a price action framework — worth exploring if you’re looking to bring more structure to your execution.
Developing Your Price Action Eye
Price action is a skill, not a system you install and run. It improves with screen time, deliberate study of historical charts, and honest review of your own trade decisions. Start by picking one or two setups — the pin bar and engulfing candle are excellent starting points — and learn to recognize them in different market conditions. Over time, you will begin to see the market’s story more fluently, and the clutter of indicators will feel less necessary.
Every price action setup still requires a clear stop loss, a defined target, and a risk management plan. Clean charts do not remove the need for disciplined risk control — they simply remove the noise so you can focus on what matters most: the price itself.
Disclaimer: This article is for educational purposes only and does not constitute financial or investment advice. Trading forex involves significant risk, and you should only trade with capital you can afford to lose. Always conduct your own research and consider seeking independent professional advice before making any trading decisions.
Photo by Adam Śmigielski on Unsplash