What Are Bollinger Bands?
Bollinger Bands are a volatility-based technical indicator developed by analyst John Bollinger in the 1980s. They consist of three lines plotted directly on a price chart: a middle band, which is a simple moving average (SMA), and two outer bands placed a set number of standard deviations above and below that average. Because standard deviation is a measure of how spread out prices have been, the bands automatically widen when the market is volatile and contract when price action quiets down.
This dynamic, self-adjusting quality is what makes Bollinger Bands genuinely useful — unlike a fixed-width channel, they respond to changing market conditions in real time. That said, they are widely misunderstood, and many traders use them in ways that lead to consistent losses rather than consistent profits.
Understanding the Settings
The Default Configuration
The standard Bollinger Band settings are a 20-period SMA as the middle band, with the outer bands set at 2 standard deviations above and below. This is the configuration John Bollinger himself recommended as a sensible starting point, and for good reason: on most timeframes and most instruments, it keeps roughly 90–95% of price action contained within the bands.
For the majority of traders, the default settings are perfectly adequate. Before experimenting with custom values, it is worth mastering what the indicator tells you at its standard configuration.
When and How to Adjust
If you move to a shorter-period SMA — say, 10 periods — the middle band reacts faster to recent price moves, but it also generates more noise and false signals. A longer period, such as 50, smooths things out but makes the indicator slower to respond to developing conditions. The 2 standard deviation setting can also be tweaked: some traders use 1.5 standard deviations for tighter bands (more signals, more noise) or 2.5 for wider bands (fewer signals, higher confidence).
As a general rule: only adjust settings when you have a specific, testable reason to do so — and always verify any changes against historical price data before trading live. For guidance on how to do that rigorously, see this step-by-step guide to backtesting.
Key Trading Signals
The Bollinger Squeeze
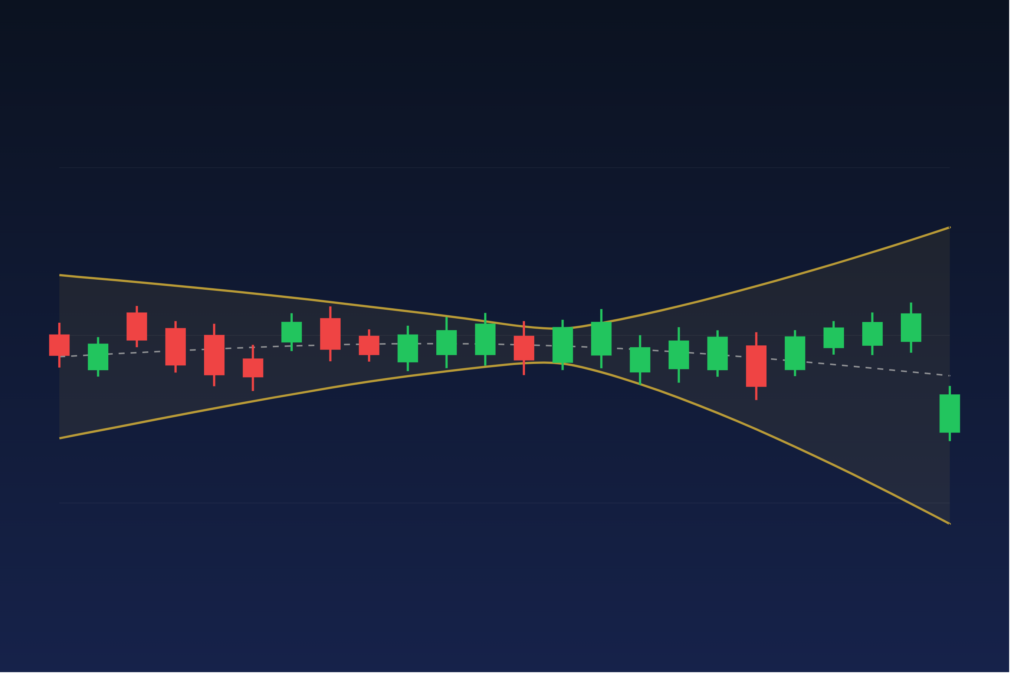
One of the most reliable setups generated by Bollinger Bands is the squeeze. This occurs when the bands narrow significantly, indicating that volatility has compressed and the market is consolidating. History shows that low-volatility periods are typically followed by high-volatility breakouts — the squeeze is the market coiling before it moves.
A squeeze alone does not tell you the direction of the breakout. Traders typically wait for price to close convincingly outside the bands after a squeeze, or look to other indicators — such as ADX to confirm whether a real trend is developing — before committing to a position. Another useful tool in this context is Donchian Channels, which can help identify the breakout range more clearly.
Band Walks During Strong Trends
During a strong directional trend, price will often “walk” along the upper or lower band, repeatedly touching or closing outside it session after session. This is normal and healthy behaviour in a trending market — it is not a sell signal just because price is at the upper band, or a buy signal because it has reached the lower band.
Understanding this distinction is critical. Treating the bands as hard reversal levels in a trending environment is one of the most common — and expensive — mistakes retail traders make.
Mean Reversion Setups
In a ranging market, the bands do function more like dynamic support and resistance zones. Price that reaches the upper band and shows signs of rejection — particularly when paired with a candlestick reversal pattern — can offer a mean-reversion trade back toward the middle band. Recognising candlestick reversal patterns alongside band touches significantly improves the quality of these setups.
The middle band (20-period SMA) itself acts as a meaningful support or resistance level in many trending conditions. A pullback to the midline during an uptrend, followed by a bounce, is a classic entry signal that many experienced traders look for.
Common Mistakes to Avoid
Treating the Bands as Automatic Buy/Sell Signals
The single biggest misconception about Bollinger Bands is that touching the upper band means “sell” and touching the lower band means “buy.” As explained above, this holds only in ranging conditions. In a trending market, this approach consistently fades winners and fights the dominant direction — a recipe for losses.
Always identify the market regime first (trending or ranging) before deciding how to interpret band touches. Indicators like ADX or MACD can help you establish that context.
Using Bollinger Bands in Isolation
Bollinger Bands measure volatility and relative price levels — they do not measure momentum, trend strength, or market structure on their own. Relying on them as your sole decision-making tool leaves critical information gaps. Pairing them with a momentum oscillator like RSI can add meaningful confluence: for example, price touching the upper band while RSI is showing overbought conditions in a range carries much more weight than either signal alone. That said, resist the urge to pile on indicators — as discussed in this guide on chart clutter, more is rarely better.
Ignoring the Middle Band
Many traders focus exclusively on the outer bands and completely overlook the middle band — the 20-period SMA. This is a mistake. The midline is a dynamic average that acts as a trend filter and a meaningful reference point for both entries and exits. A price that consistently holds above the midline is in an uptrend; one that consistently fails to reclaim it is in a downtrend. Factoring the midline into your analysis makes Bollinger Band trading considerably more nuanced and accurate.
Putting It All Together
Bollinger Bands are a genuinely powerful tool when used correctly — that means understanding the settings, reading the signals in the context of the current market regime, and avoiding the trap of treating them as a simple buy-low, sell-high indicator. Combine them with complementary tools, keep your chart clean, and always test your approach before deploying it with real capital.
If you trade on MetaTrader and want ready-built tools to help apply volatility-based strategies more systematically, the indicators and Expert Advisors at MGH Products are worth exploring.
Disclaimer: This article is for educational purposes only and does not constitute financial or investment advice. Trading forex involves significant risk, and you should only trade with capital you can afford to lose.