The Temptation to Add More
When traders first discover technical indicators, it is easy to fall into a familiar trap: if one indicator is helpful, surely five must be better. Within a few weeks, charts become cluttered with overlapping lines, oscillators stacked below the price window, and alerts firing in every direction. The result is rarely better trading — it is usually paralysis.
There is no single magic number of indicators that suits every trader or every strategy, but there are clear principles that separate productive chart setups from noisy ones. Understanding those principles is the real skill.
What Indicator Overload Actually Does to You
Adding too many indicators creates two specific problems that are easy to underestimate.
Conflicting Signals
Most popular indicators — RSI, Stochastic, CCI, and Williams %R, for example — are all momentum oscillators. They measure roughly the same thing using slightly different formulas. When you place all four on one chart, you are not gaining four independent perspectives; you are receiving four slightly different versions of a single idea. When they disagree (and they will), you have no logical way to choose between them, so you end up doing nothing or, worse, picking the one that confirms what you already wanted to do.
Analysis Paralysis
The human brain can only process a limited amount of information before decision quality degrades. A chart with eight indicators does not make you eight times more informed — it makes each individual signal harder to trust. Studies in cognitive psychology consistently show that more choice and more information beyond a certain threshold leads to worse decisions, not better ones. Trading is no exception.
A Practical Framework: The Three-Layer Approach
Rather than counting indicators arbitrarily, think in terms of what each indicator is supposed to tell you. A well-organized chart typically covers three distinct layers of information, and ideally uses no more than one or two tools per layer.
Layer 1 — Trend Direction
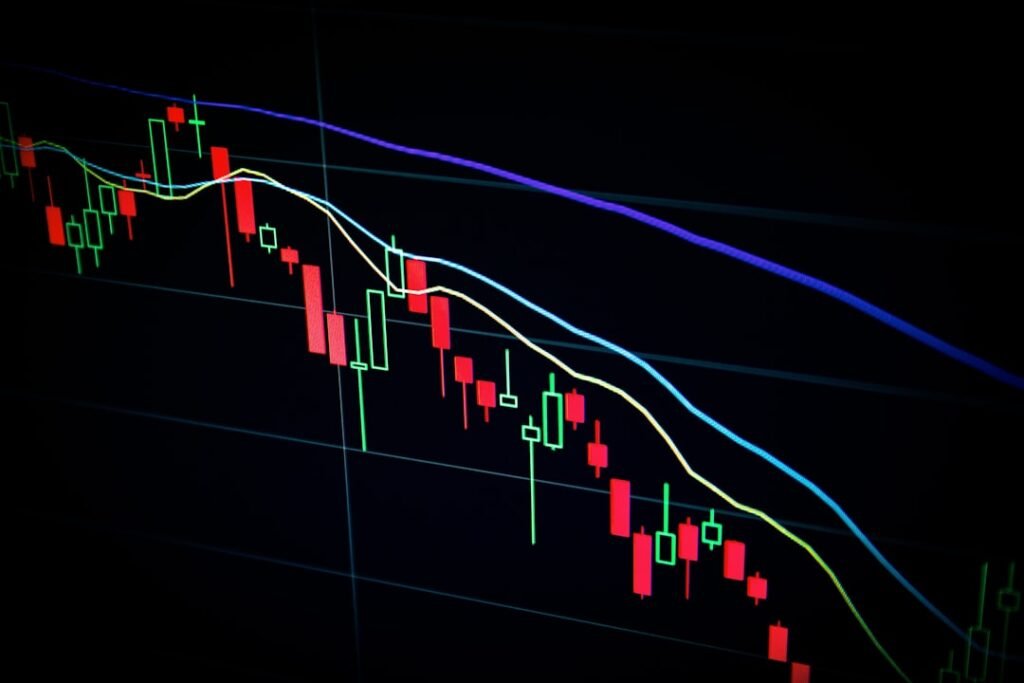
Your first question should always be: what direction is the market moving? Tools that answer this include moving averages (such as the 20 EMA or 50 SMA), the ADX, or a simple trend line drawn on the chart itself. One or two moving averages overlaid on the price candles is usually enough. They show you whether price is above or below a key level, and whether momentum is pointing up or down.
Layer 2 — Momentum or Timing
Once you know the trend, the next question is: is there energy behind this move, and is the market overbought or oversold relative to recent price action? This is where a single oscillator — RSI, Stochastic, or MACD — does the job. Pick one and learn it well. Using RSI and Stochastic simultaneously, as mentioned above, usually adds noise rather than clarity.
Layer 3 — Volatility or Context
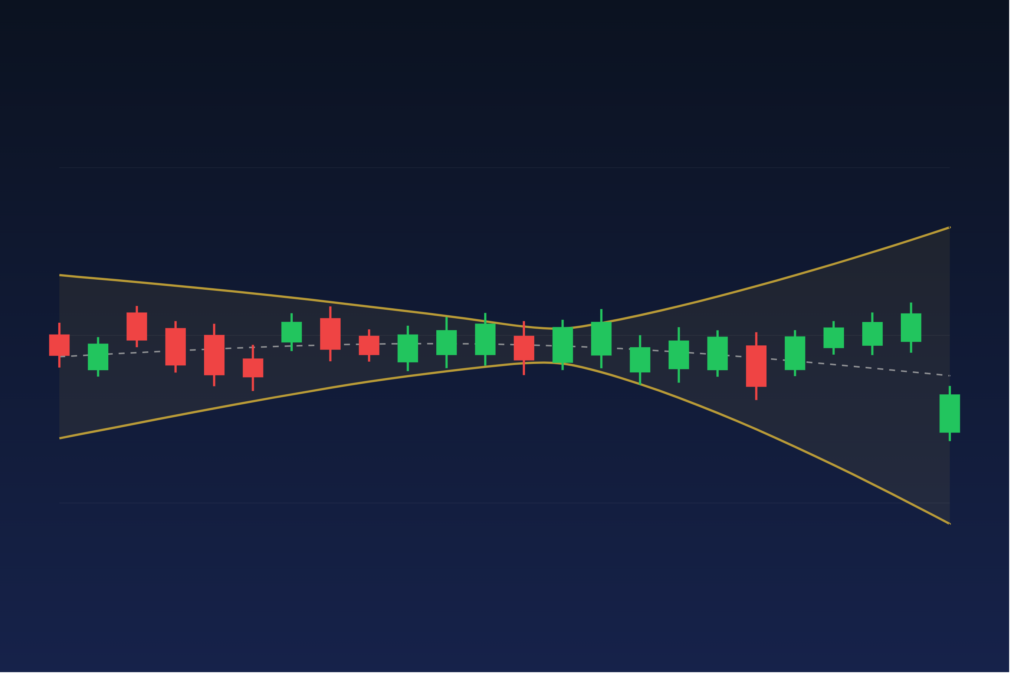
Some traders add a third layer to gauge market conditions. Bollinger Bands, Average True Range (ATR), or a volume indicator can tell you whether the market is ranging quietly or expanding with momentum. This helps you set realistic stop distances and avoid entering during low-liquidity chop. Again, one tool is enough here.
Under this framework, a complete, functional chart might contain: one or two moving averages, one oscillator, and one volatility measure. That is three to four indicators total — and every single one has a specific, non-overlapping job.
Quality Over Quantity: What Really Improves Results
The traders who build lasting edge in technical analysis are almost never the ones with the most indicators. They are the ones who understand their chosen tools deeply — who know exactly what conditions cause those signals to be reliable and what conditions cause them to fail.
For example, RSI divergence is a well-respected signal, but it works very differently in a strong trend than it does in a range. A trader who uses only RSI and understands those nuances will outperform a trader using seven indicators with a shallow understanding of each.
Backtesting Is Your Reality Check
One practical way to discipline yourself is to test your setup historically. If you cannot clearly define the rules for each indicator on your chart — entry, exit, filter — you have too many. A good rule of thumb: if you cannot explain your chart setup in two sentences, simplify it. Backtesting also reveals whether adding a second oscillator genuinely improves your win rate or just makes the chart feel more authoritative.
Clean Charts Build Better Habits
There is also a psychological benefit to simplicity. A clean chart trains you to read price action itself rather than waiting for a committee of indicators to agree. Over time, you develop an intuitive feel for market structure that no indicator can fully replace. Indicators are tools to confirm and quantify what you observe — not substitutes for observing.
If you use MetaTrader 4 or 5 and want well-designed, purposeful indicators that are built to complement each other rather than overlap, the tools available at mghfx.com are worth exploring as part of a disciplined, minimal setup.
A Simple Starting Point
If you are unsure where to begin, try this exercise: remove every indicator from one of your charts and trade using only price action and a single moving average for one week. Notice what you see that you missed before. Then add back indicators one at a time, asking each time: does this genuinely change my decision, or does it just confirm what price is already telling me? Keep only the ones that pass that test.
The goal is not a bare chart for its own sake — it is a chart where every element earns its place.
Disclaimer: This article is for educational purposes only and does not constitute financial or investment advice. Trading forex and CFDs carries significant risk. Always conduct your own research and consult a qualified financial adviser before making trading decisions.
Photo by Brett Jordan on Unsplash