Pass: www.mghfx.com
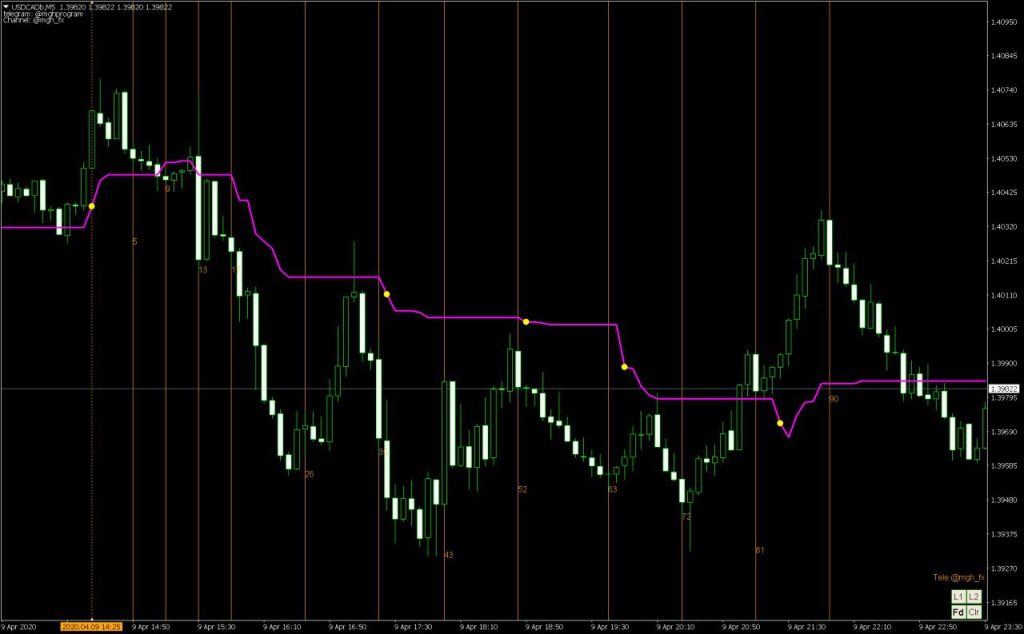
This indicator reveals reversal points and is based on the Kijun-sen line. You can change its value from the settings and test other Ichimoku numbers such as 17, 52, 78, 103, 114, etc.
Strategy :
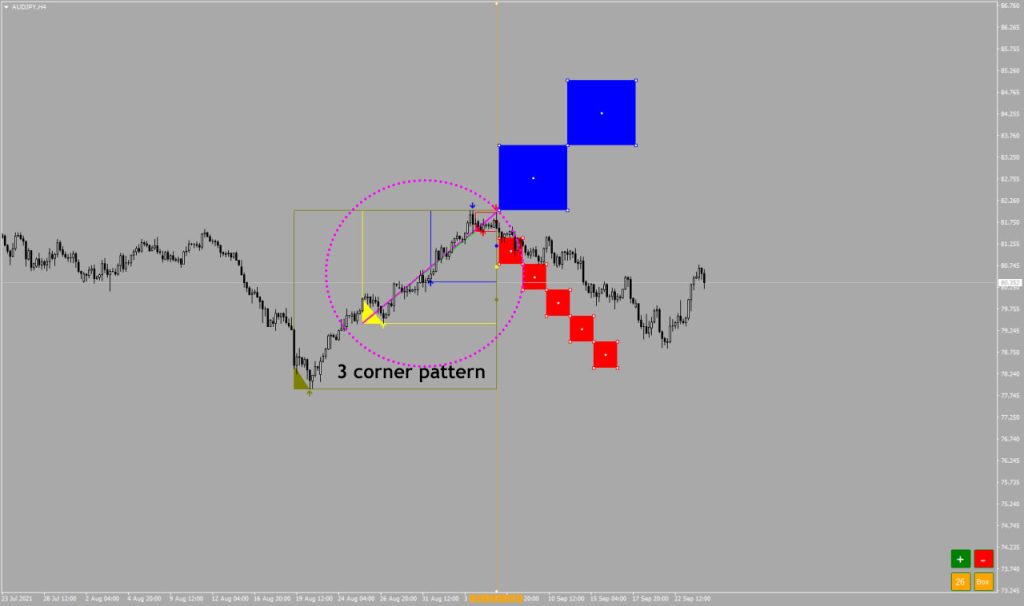
If in the past, the Kijun-sen line and the direction line have synchronized in a flat market, we will probably have a reversal in the next 26 candles. If a vertical line appears, there is a possibility of a reversal.
There is another application for when you are in a profitable position and looking for an exit point in terms of time. You can exit or risk-free with the signal of this indicator.
This indicator checks time from one minute to 4 hours (or more). If there is a vertical line in the last 10 candles, it is printed in the lower right corner of the image.


Notes :
- The higher the time frame of the vertical line, the more valid it becomes.
- Creating a new vertical line in a time frame can shorten the duration of an older vertical line’s reversal.
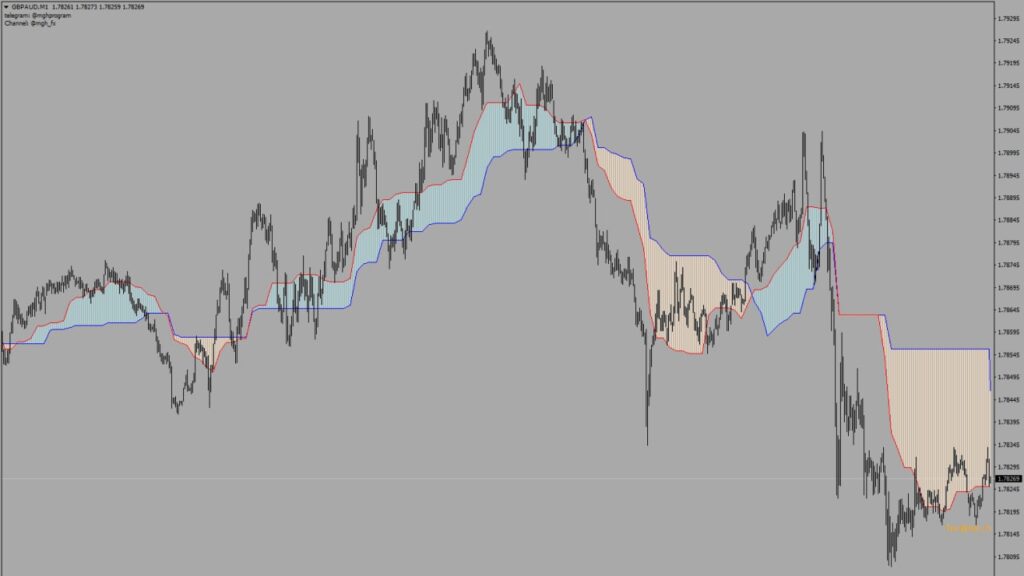
- In the vertical line, the signal is stronger if the price is above or below both lines.
- Reversal doji or candlesticks such as engulfing and piercing are suitable confirmations for the trend reversal in a vertical line.
- Columns that are close to the intersection of two lines will likely have good reversal lines.
- At the point where two lines intersect, we may have a reversal.