Pass: www.mghfx.com
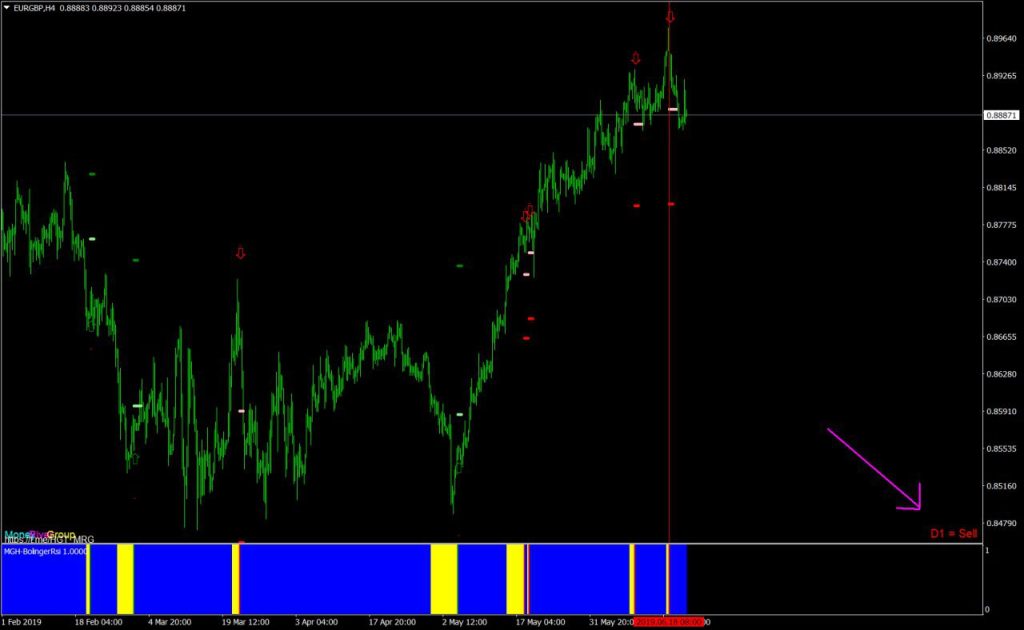
This indicator determines the possible reverse or price return points based on the distance between the ichi numbers and the end of the 52-period Kijsen flat.
Strategy :
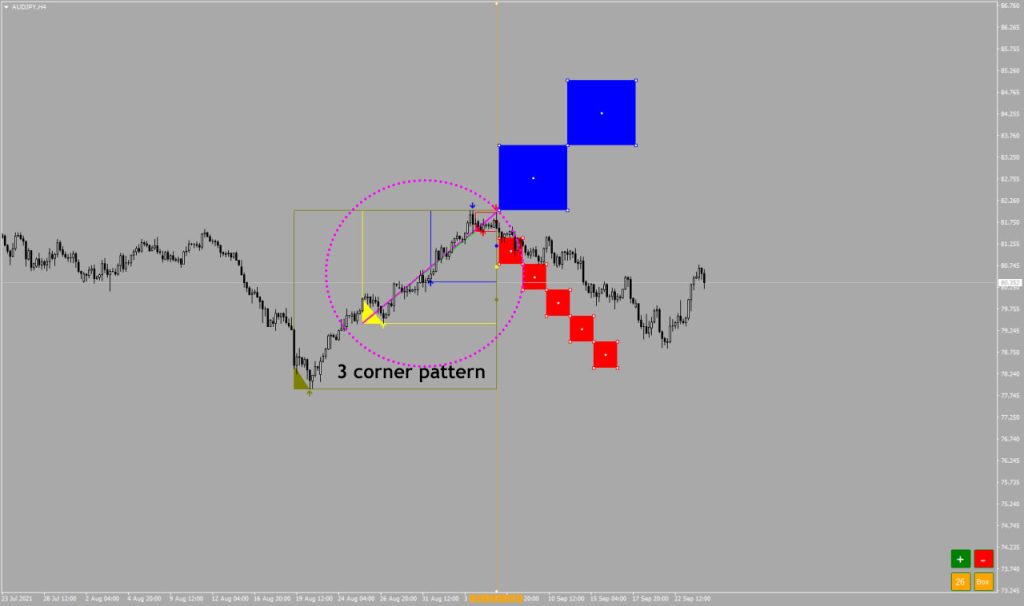
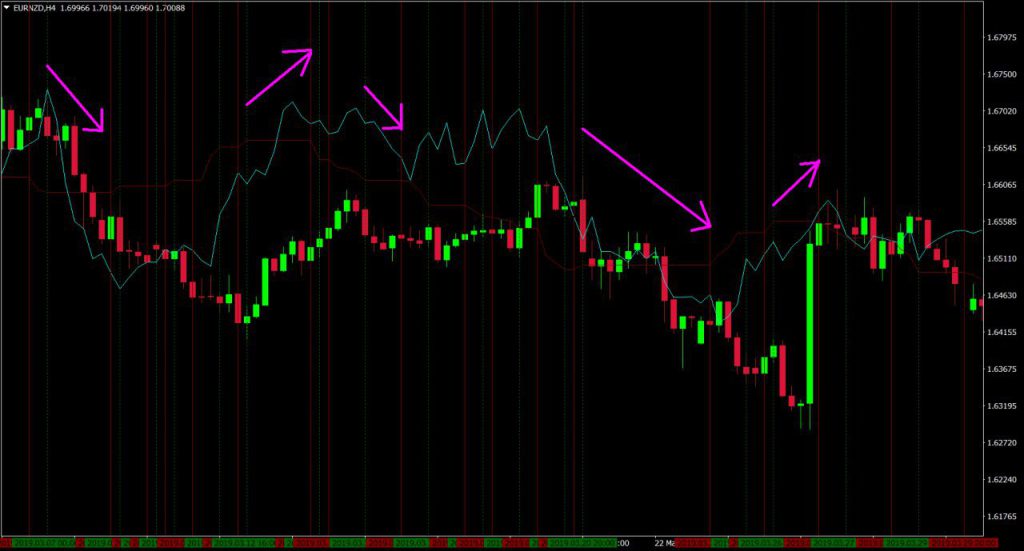
Set the L1 and L2 lines from the settings to Ichimoku numbers (which are set by default). Then, by pressing the L1 or L2 button and dragging the vertical line that appears on the yellow dots, future time analysis will appear in the form of vertical lines. These lines indicate areas where there is a possibility of a price return.
Indicator features:
- Possible Kijun-sen shift
- Option to determine the minimum flatness
- Possibility to determine the Kijun-sen course
- Option to specify Ichimoku numbers
- Kijun-sen future forecast up to 26 periods