Pass: www.mghfx.com
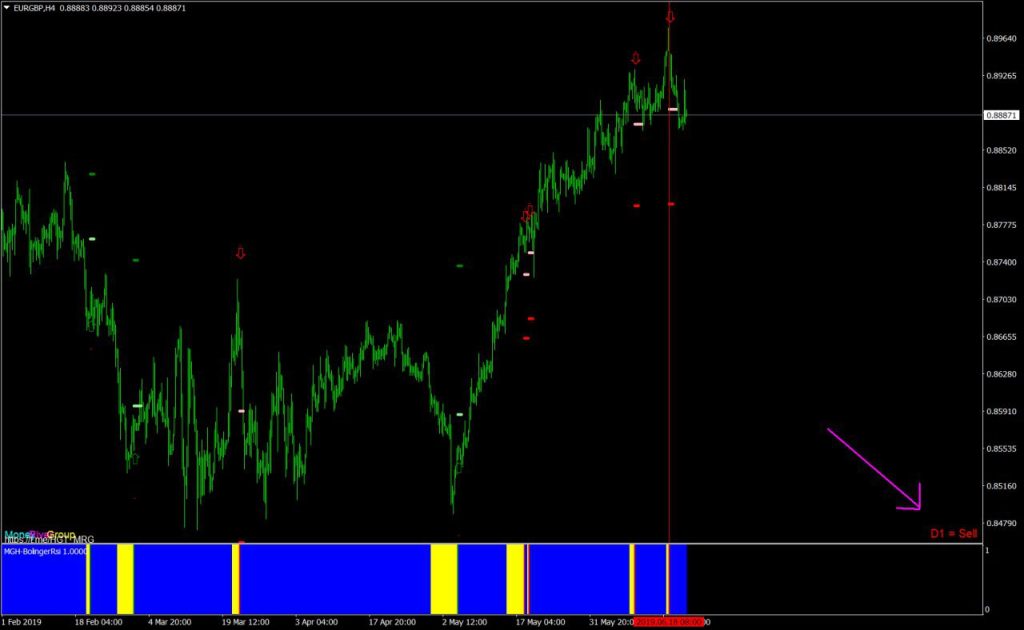
This indicator is designed to work with the London session and the opening time of the London market. After the closing of the half-hour candle, it determines the high and low of that candle as the base ceiling and floor. It then selects two buy and two sell triggers for each vertical based on the 10% and 20% ATR (daily ATR) distance from the high and low of the half-hour candle.
- First TP : is set at half the distance of the first buy and sell trigger
- Second TP : is set as long as the distance between the first buy and sell trigger.
- Third TP : is set at half the distance of the second buy and sell trigger
- Fourth TP : is set as long as the distance between the second buy and sell trigger.
Most of the positions taken using this strategy are successful and it can be used as a good trading strategy.

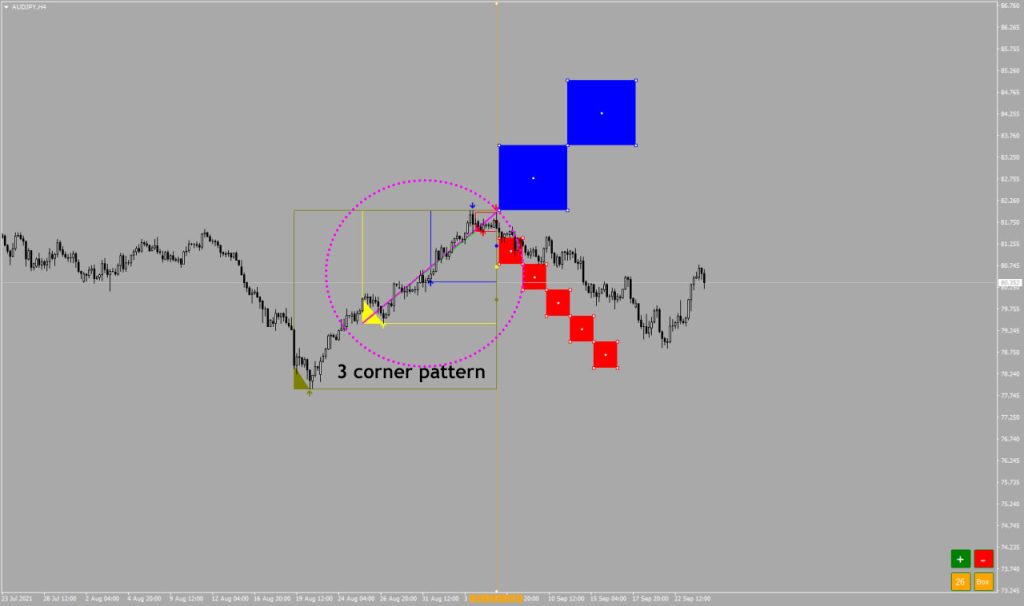
In the photo above, we create a vertical column at 10 o’clock (the opening time of the London market) and wait for the current half-hour candle in the 30M time frame to close. Once the candle has closed, a vertical column is created on this candle and our triggers are automatically determined. We should wait until one bar after the trigger has closed before entering a position in the same direction as the closing bar.
For example :
You can use the “H”, “Bs”, or “Ss” buttons of the TradeHelper tool to transfer a buy stop or sell stop and specify the stop loss and take profit locations with the other buttons of this tool.”