What Is a Candlestick Chart?
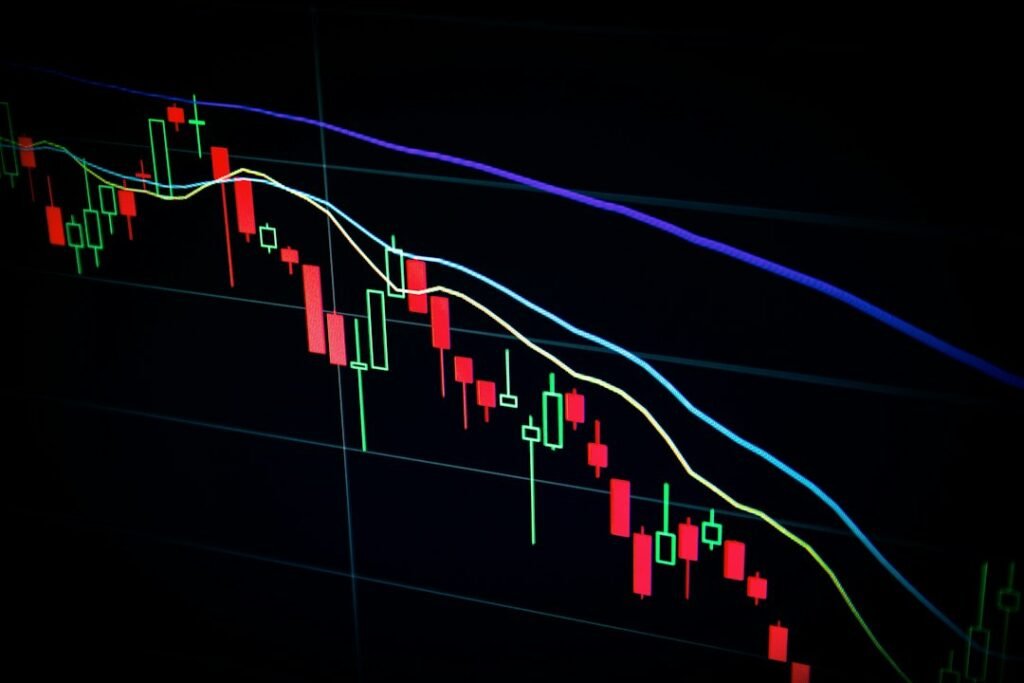
A candlestick chart is the most widely used chart type in forex and stock trading. Unlike a simple line chart that only shows closing prices, each “candle” on this type of chart packs four critical pieces of information into a single visual: the open, close, high, and low price for a given time period. Whether you’re looking at a 5-minute chart or a daily chart, the structure of each candle works exactly the same way.
Candlestick charts originated in 18th-century Japan, where rice traders used them to track price movements. Today, they are the default chart type for most retail traders worldwide — and for good reason. They communicate market sentiment visually and efficiently, making patterns far easier to spot than raw numbers ever could.
If you’re just getting started in trading, understanding candlestick charts is one of the most fundamental skills you can build. Before worrying about complex indicators or strategies, being able to fluently “read” a chart gives you a vital edge.
Anatomy of a Single Candlestick
Every candlestick has two main parts: the body and the wicks (also called shadows or tails).
- Body: The thick rectangular section of the candle. It represents the range between the opening and closing price. If the close is higher than the open, the candle is typically green (bullish). If the close is lower than the open, it is typically red (bearish).
- Upper wick: The thin line extending above the body. It shows the highest price reached during that time period.
- Lower wick: The thin line extending below the body. It shows the lowest price reached during that time period.
Here’s a practical example: Imagine EUR/USD opens at 1.1000, rallies to 1.1050, drops to 1.0980, and finally closes at 1.1030. The body of that candle spans from 1.1000 to 1.1030 (green/bullish), the upper wick reaches to 1.1050, and the lower wick stretches down to 1.0980. In one glance, you can see the overall directional bias, the range of price movement, and where price was ultimately rejected.
The size and shape of the body versus the wicks tells a story. A candle with a long body and short wicks shows strong, decisive movement in one direction. A candle with a small body and very long wicks suggests indecision — the market tested both extremes but couldn’t commit. This is the kind of nuance that separates traders who genuinely read charts from those who just glance at them.
Key Candlestick Patterns Every Beginner Should Know
Once you understand individual candle anatomy, you can start recognizing patterns — combinations or shapes that suggest what might happen next. These patterns don’t predict the future with certainty, but they highlight moments where market sentiment may be shifting.
Single-Candle Patterns
- Doji: The open and close are at virtually the same price, creating a cross-like shape. This signals indecision between buyers and sellers. When a Doji appears after a strong trend, it can be an early warning of a reversal.
- Hammer: A candle with a small body near the top and a long lower wick. It appears after a downtrend and suggests that sellers drove price lower during the session, but buyers stepped in strongly and pushed it back up — a potential bullish reversal signal.
- Shooting Star: The mirror image of a hammer. A small body near the bottom with a long upper wick. It appears after an uptrend and signals that buyers pushed price higher, but sellers took over and drove it back down — a potential bearish reversal signal.
- Marubozu: A full-bodied candle with no wicks at all. This shows that one side completely dominated the session — a bullish Marubozu opens at the low and closes at the high; a bearish one opens at the high and closes at the low. These candles signal very strong momentum.
Multi-Candle Patterns
- Bullish Engulfing: A small bearish candle followed by a larger bullish candle whose body completely “engulfs” the previous one. It signals that buying pressure has overwhelmed selling, and a move higher may follow.
- Bearish Engulfing: The reverse — a small bullish candle followed by a larger bearish candle. Signals that sellers have taken control.
- Morning Star / Evening Star: These are three-candle reversal patterns. The Morning Star appears at the bottom of a downtrend: a large bearish candle, a small indecisive candle (often a Doji), and then a large bullish candle. The Evening Star is the bearish counterpart at the top of an uptrend.
It’s worth emphasizing: no pattern works in isolation. Always consider the broader trend, nearby support and resistance levels, and volume. A Hammer at a major support level carries far more weight than the same shape appearing in the middle of choppy price action. Understanding how key levels like pivot points work can greatly strengthen how you interpret candlestick signals.
Using Candlestick Charts in Practice
Reading candlestick charts isn’t just an academic exercise — it feeds directly into your decision-making process for entries, exits, and trade management. Here’s how to approach it practically:
- Identify the trend first: Before zooming in on individual candles, zoom out. Is price making higher highs and higher lows (uptrend), or lower highs and lower lows (downtrend)? Patterns are most meaningful when read in the context of the prevailing trend.
- Look for confluence: A candlestick reversal pattern is stronger when it lines up with a support/resistance zone, a moving average, or other technical signals. Never trade a candle pattern in a vacuum.
- Pair patterns with proper risk management: Even the strongest-looking candle pattern can fail. Always define your stop-loss level before entering, and make sure your potential reward justifies the risk. Brushing up on risk-reward ratio principles is essential reading for any beginner building this habit.
- Practice on a demo account: Before applying candlestick analysis with real money, spend time on a demo account identifying and logging these patterns. Starting with a demo account allows you to build pattern recognition without financial risk.
Traders who want to automate or enhance their chart reading can explore purpose-built MetaTrader tools. MGH Products offers a range of indicators and Expert Advisors at mghfx.com designed to help traders apply technical concepts — including price action analysis — more consistently in the MetaTrader environment.
A Note on Candlestick Chart Limitations
Candlestick charts are powerful, but they’re not crystal balls. A few honest caveats every beginner should internalize:
- Patterns are probabilistic, not guaranteed. Markets can and do “fail” even the clearest setups.
- Different timeframes tell different stories. A bearish pattern on a 5-minute chart may be completely irrelevant noise on the daily chart.
- The more you search for patterns, the more you’ll see them — even where they don’t truly exist. This is called pattern overfitting, and it’s a common trap for beginners.
The goal is to use candlestick analysis as one lens among many — combined with trend analysis, support and resistance, and sound trade management — rather than as a standalone crystal ball.
Mastering how to read candlestick charts takes time and screen-time practice, but it is one of the most transferable skills in trading. Whether you’re trading forex, stocks, or commodities, the language of candlesticks is universal. Start simple, build your pattern vocabulary gradually, and always anchor your chart reading in disciplined risk management.
Disclaimer: This article is for educational purposes only and does not constitute financial advice. Trading forex and other financial instruments carries significant risk. Always conduct your own research and consult a qualified financial professional before making trading decisions.
Photo by Maxim Hopman on Unsplash