What Is the Ichimoku Cloud?
The Ichimoku Kinko Hyo — commonly shortened to the Ichimoku Cloud — is one of the most comprehensive technical indicators available to forex traders. Developed by Japanese journalist Goichi Hosoda in the late 1930s and published in 1969, it was designed to give traders a complete picture of price action at a single glance. Unlike most indicators that focus on one dimension of the market, the Ichimoku system simultaneously identifies trend direction, momentum, support and resistance levels, and potential entry and exit signals.
Despite its visually complex appearance, the logic behind the Ichimoku Cloud is systematic and learnable. Once you understand each of its five components, you can read the chart with surprising clarity.
The Five Components of the Ichimoku System
Each line in the Ichimoku system serves a distinct purpose. Understanding what each one measures is the foundation of using the strategy effectively.
1. Tenkan-sen (Conversion Line)
The Tenkan-sen is calculated as the midpoint of the highest high and lowest low over the past 9 periods. It functions similarly to a short-term moving average and reflects near-term price momentum. When price is consistently above the Tenkan-sen, short-term momentum is bullish. When it crosses below, momentum is weakening.
2. Kijun-sen (Base Line)
The Kijun-sen uses the same midpoint calculation but over 26 periods, making it a medium-term trend indicator. It acts as a dynamic support or resistance level. A price close above the Kijun-sen generally signals bullish strength; a close below signals bearish pressure. Many traders treat this line as a trailing stop reference.
3. Senkou Span A (Leading Span A)
This is the midpoint of the Tenkan-sen and Kijun-sen, plotted 26 periods into the future. It forms one boundary of the Kumo (cloud). Because it is projected forward, it gives traders advance visibility into potential future support and resistance zones.
4. Senkou Span B (Leading Span B)
Calculated as the midpoint of the highest high and lowest low over the past 52 periods and plotted 26 periods forward, Senkou Span B is the slower boundary of the cloud. The wider the space between Span A and Span B, the stronger the identified support or resistance is considered to be.
5. Chikou Span (Lagging Span)
The Chikou Span is simply the current closing price plotted 26 periods back in time. It is used as a confirmation tool: when the Chikou Span is above price from 26 periods ago, it confirms bullish sentiment; when it is below, it confirms bearish sentiment. Many traders will not take a trade unless the Chikou Span aligns with their directional bias.
Reading the Kumo (Cloud)
The cloud itself — the shaded area between Senkou Span A and Span B — is the most visually distinctive element of the system and arguably its most powerful feature.
- Trend direction: When price is above the cloud, the market is in an uptrend. When price is below the cloud, the market is in a downtrend. Price trading inside the cloud signals indecision or consolidation, and many Ichimoku traders avoid taking positions in this zone.
- Cloud thickness as strength: A thick cloud indicates strong support or resistance. A thin cloud suggests weaker structure that price may breach more easily.
- Cloud color (Kumo Twist): When Senkou Span A crosses above Span B, the cloud turns bullish (often displayed in green). When Span A crosses below Span B, the cloud turns bearish (often red). These crossovers — called Kumo Twists — signal potential trend changes and can be watched even in advance, since the cloud is projected forward.
Practical Ichimoku Trading Strategies
The TK Cross
One of the most popular entry signals is the Tenkan-sen/Kijun-sen cross, often called the TK Cross. A bullish TK Cross occurs when the Tenkan-sen crosses above the Kijun-sen; a bearish TK Cross occurs when it crosses below. Signal strength is categorized by location:
- Strong signal: The cross occurs above the cloud (bullish) or below the cloud (bearish).
- Neutral signal: The cross occurs inside the cloud.
- Weak signal: The cross occurs on the opposite side of the cloud from the expected direction.
Experienced traders typically only act on strong or neutral signals, and always cross-check against the Chikou Span for confirmation.
Kumo Breakout Strategy
A Kumo breakout occurs when price moves from below the cloud to above it, or vice versa. This is considered one of the highest-probability trend-change signals in the Ichimoku system. Traders wait for a candle to close clearly above or below the cloud — not just wick through it — before entering. A confirmed Chikou Span and a Kumo Twist projecting in the same direction further strengthen the setup.
Kijun-sen Bounce
In a trending market, price frequently pulls back to the Kijun-sen before continuing in the trend direction. Traders use this pullback as a low-risk entry opportunity, placing stops below the cloud when buying, or above the cloud when selling. This strategy works best when all other Ichimoku elements are aligned with the trend.
Combining Ichimoku With Other Tools
The Ichimoku system is robust on its own, but many traders combine it with volume analysis, RSI, or candlestick patterns to filter out false signals — particularly during low-liquidity periods or ahead of major economic releases. The system tends to perform best on higher timeframes (H4, Daily, Weekly), where the default settings (9, 26, 52) were originally calibrated.
For traders who want to streamline this multi-layered analysis within MetaTrader, custom indicators and automated tools can help visualize signals more clearly and reduce the manual workload. MGH Products at mghfx.com offers a range of MetaTrader indicators and Expert Advisors designed to support systematic trading approaches like this one.
Conclusion
The Ichimoku Cloud is not just an indicator — it is a complete trading framework. By mastering its five components and understanding how they interact, forex traders gain a disciplined, structured approach to identifying trend, momentum, and high-probability entry points. Like any system, it rewards patience and consistency over impulsive application. Start by observing the cloud on higher timeframes, practice reading all five components together, and only trade when multiple signals align in the same direction.
Disclaimer: This article is intended for educational purposes only and does not constitute financial advice. Trading forex carries significant risk, and past performance of any strategy is not indicative of future results. Always conduct your own research and consider consulting a qualified financial professional before making any trading decisions.
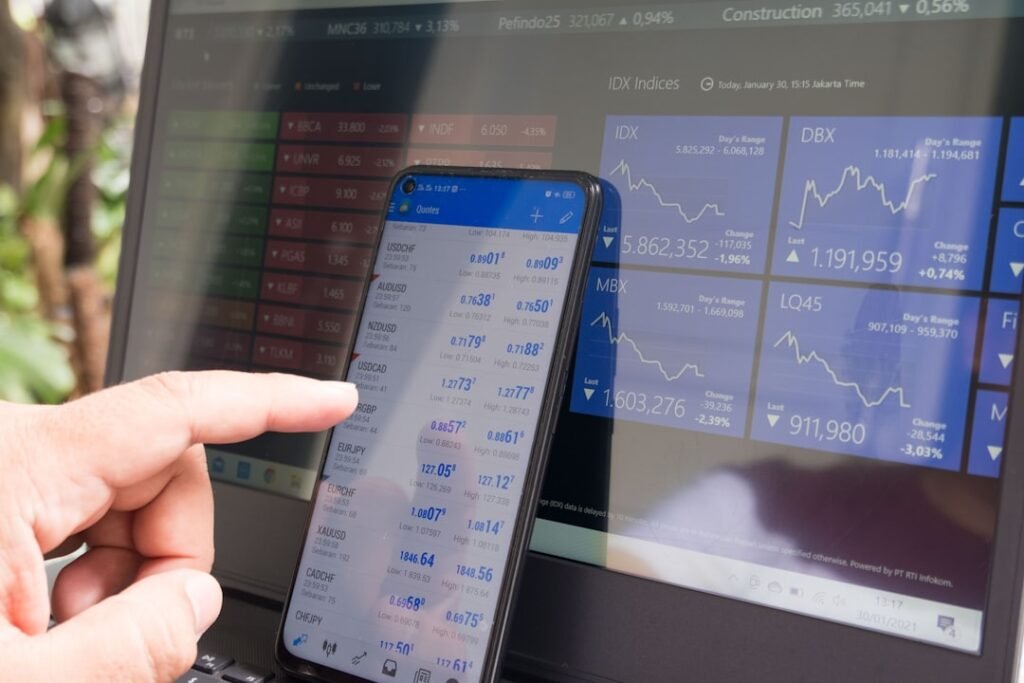
Photo by Marga Santoso on Unsplash