Why Support and Resistance Are the Foundation of Technical Trading
Before indicators, before oscillators, before complex algorithms — there are levels. Support and resistance are the backbone of technical analysis, representing the price zones where buyers and sellers have historically battled for control. Understanding how to identify these levels accurately is one of the most transferable skills a trader can develop, regardless of the market, timeframe, or strategy they use.
At its core, a support level is a price area where buying interest has been strong enough to halt or reverse a decline. A resistance level is the opposite — a price area where selling pressure has consistently capped rallies. These zones exist because of human psychology: traders remember where price turned before, and they tend to act at those same levels again.
How to Identify High-Probability Support and Resistance Levels
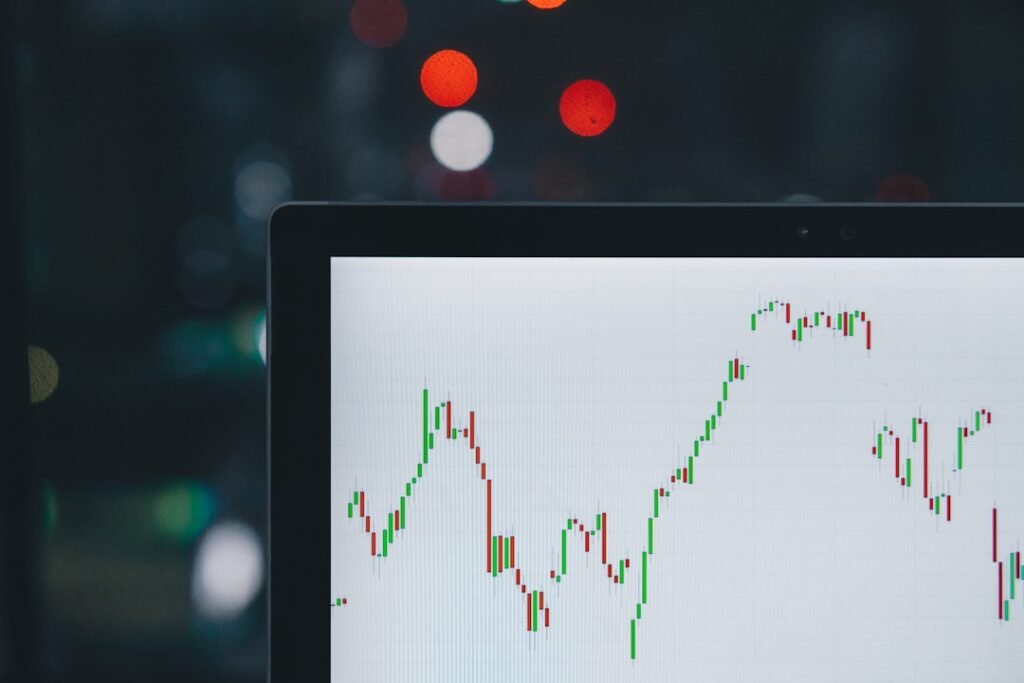
Not all levels are created equal. A line drawn randomly on a chart means nothing. A level earns significance through evidence — the more times price has reacted to it, and the more prominently it did so, the more reliable it becomes.
1. Look for Multiple Touches
A level that price has tested and respected two or more times carries far more weight than one that has only been touched once. Each additional touch confirms that market participants are actively defending that zone. Three or more clear reactions at the same price area signal a level worth watching closely.
2. Prioritize Higher Timeframes
Levels formed on daily, weekly, or monthly charts represent the decisions of institutional traders and major market participants. A resistance zone visible on the weekly chart will carry more significance than one only visible on the 15-minute chart. A practical approach is to identify key levels on the higher timeframes first, then drop down to lower timeframes to look for precise entries within those zones.
3. Observe the Strength of the Reaction
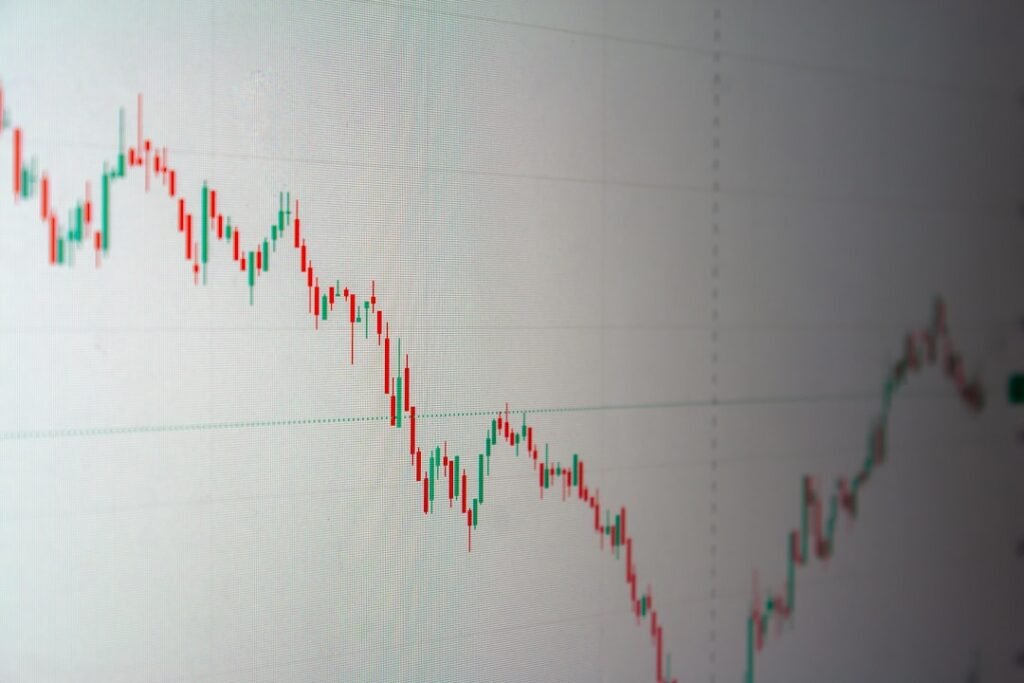
Not all bounces are equal. A level from which price reversed sharply — leaving behind a long candlestick wick or a sequence of strong rejection candles — is stronger than a level where price merely drifted sideways before reversing. Sharp, decisive reactions indicate that significant order flow was present at that price.
4. Note Round Numbers and Psychological Levels
Price tends to gravitate toward round numbers such as 1.2000, 1.2500, or 1.3000 in forex pairs. These levels attract attention because traders, banks, and corporations naturally place orders at clean, memorable prices. When a round number coincides with a historically significant swing high or low, the confluence makes the level considerably more powerful.
Support Becomes Resistance — and Vice Versa
One of the most reliable and underused concepts in technical analysis is role reversal. When a support level is decisively broken, it frequently becomes a resistance level on any subsequent rally back to that zone — and the same principle works in reverse for broken resistance levels.
The logic is straightforward: traders who bought at support and watched price fall through are now sitting on losing positions. When price retraces back to their entry level, many will exit to cut their losses, creating selling pressure at the old support zone. This behavioural pattern repeats across all markets and timeframes, making role reversal one of the most consistent setups in price action trading.
Example: Imagine EUR/USD builds a base at 1.0800, bouncing from it three times over several weeks. Then a piece of news drives price sharply below 1.0800. On the next rally, price climbs back toward 1.0800 but stalls and reverses — now acting as resistance. A trader who understands role reversal would watch that zone for short-entry setups rather than buying into it blindly.
Zones, Not Lines — Thinking in Terms of Areas
A common mistake among newer traders is treating support and resistance as exact price lines rather than zones or ranges. In reality, price rarely turns on a single pip. Instead, it enters a zone of interest — typically spanning a range of several pips to several tens of pips depending on the pair and timeframe — before reacting.
Drawing your levels as rectangular zones rather than horizontal lines forces a more realistic view of the market. It also helps you avoid being shaken out of trades by minor wicks that temporarily pierce a level before price recovers. Ask yourself: is price entering a zone of historical significance, or has it decisively closed through it on volume? That distinction often separates a high-probability setup from a false signal.
Combining Levels with Confirmation
High-probability support and resistance trading rarely relies on levels alone. Most experienced traders wait for some form of confirmation before acting — a rejection candle, a pin bar, an engulfing pattern, or a momentum signal from a complementary indicator. The level identifies where to watch; the confirmation tells you when to act. This two-step process significantly reduces the number of false entries and improves the overall quality of trade selection.
Putting It All Together
Support and resistance trading is not about predicting the future — it is about identifying where the market has shown its hand before, and positioning yourself intelligently around those areas. The skill develops over time and with deliberate practice: chart reading, marking levels consistently, and reviewing how price behaves at your identified zones after the fact.
For traders looking to streamline this process within MetaTrader, the tools available at mghfx.com include indicators designed to help identify and visualise key price levels automatically — a useful complement to the manual analysis described here.
Mastering support and resistance gives you a universal framework that improves every other aspect of your trading, from entries and exits to stop placement and target selection. Build this skill well, and almost every other technical concept you study will begin to make more sense in context.
Disclaimer: This article is for educational purposes only and does not constitute financial or investment advice. Trading forex and CFDs carries significant risk. Always conduct your own research and consider your risk tolerance before making any trading decisions.