Bollinger Bands are one of the most widely used technical indicators in trading, yet they are also one of the most frequently misread. Developed by John Bollinger in the 1980s, the tool was designed to give traders a dynamic view of volatility and relative price levels — not simply to signal when to buy or sell. Understanding the distinction between what Bollinger Bands measure and what they predict is the foundation of using them well.
How Bollinger Bands Are Constructed
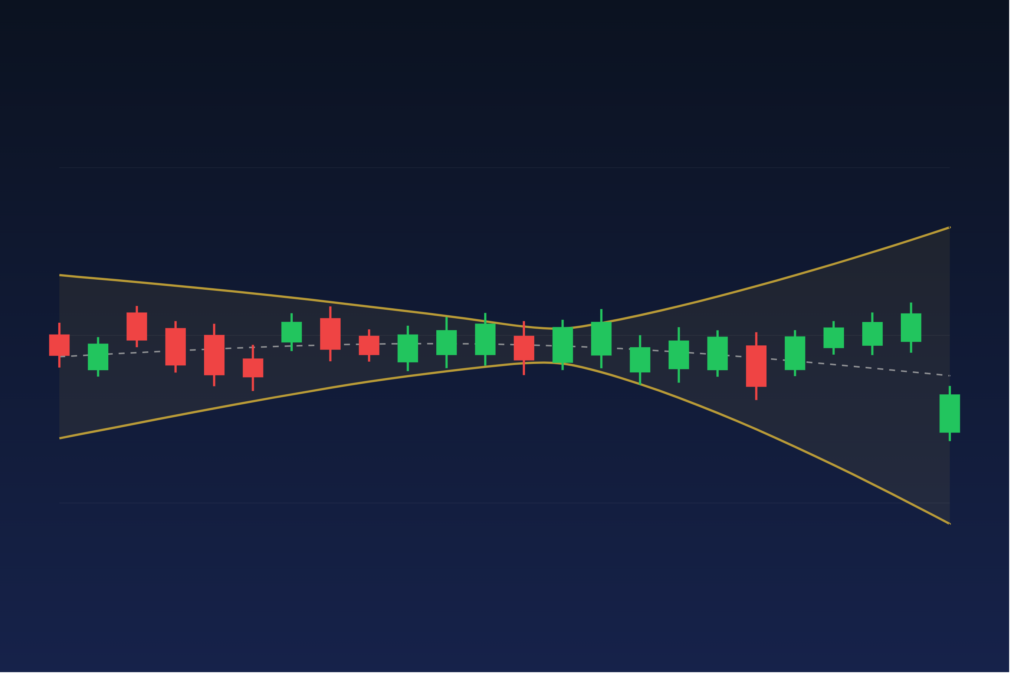
Bollinger Bands consist of three lines plotted directly on a price chart:
- Middle Band: A simple moving average (SMA), typically set to 20 periods.
- Upper Band: The SMA plus a set number of standard deviations (default is 2).
- Lower Band: The SMA minus the same number of standard deviations.
Standard deviation is the key ingredient. It measures how spread out recent price data is from the average. When volatility increases, the bands widen. When the market quiets down, the bands contract. This self-adjusting nature makes Bollinger Bands useful across different market conditions and instruments.
Choosing the Right Settings
The default 20-period SMA with 2 standard deviations works well for most traders and most timeframes. However, adjustments can be appropriate depending on your trading style:
- Shorter-term traders (scalpers, day traders): A 10-period setting with 1.5 standard deviations can make the bands more responsive to short-term price swings.
- Longer-term swing and position traders: A 50-period setting with 2.5 standard deviations smooths out noise and focuses on larger structural moves.
The key principle is that roughly 88–89% of price action should fall within a 2 standard deviation band on a normal distribution. If you find price constantly closing outside the bands on your chart, widen the standard deviation. If the bands never seem to get tested, narrow them. Calibrate to your specific instrument and timeframe before committing to a setting.
Reading Bollinger Band Signals
Bollinger Bands generate several meaningful signals, but context is everything. Using them without additional confluence is where most traders run into trouble.
The Squeeze: Volatility Contraction Before Expansion
When the bands narrow significantly — often called the Bollinger Band Squeeze — it signals a period of low volatility. Historically, low volatility tends to precede high volatility. A squeeze alone does not tell you which direction the breakout will occur, but it flags that a significant move may be coming. Traders often pair this signal with volume analysis or a momentum oscillator to anticipate the direction of the eventual breakout.
Walking the Bands: Trend Continuation
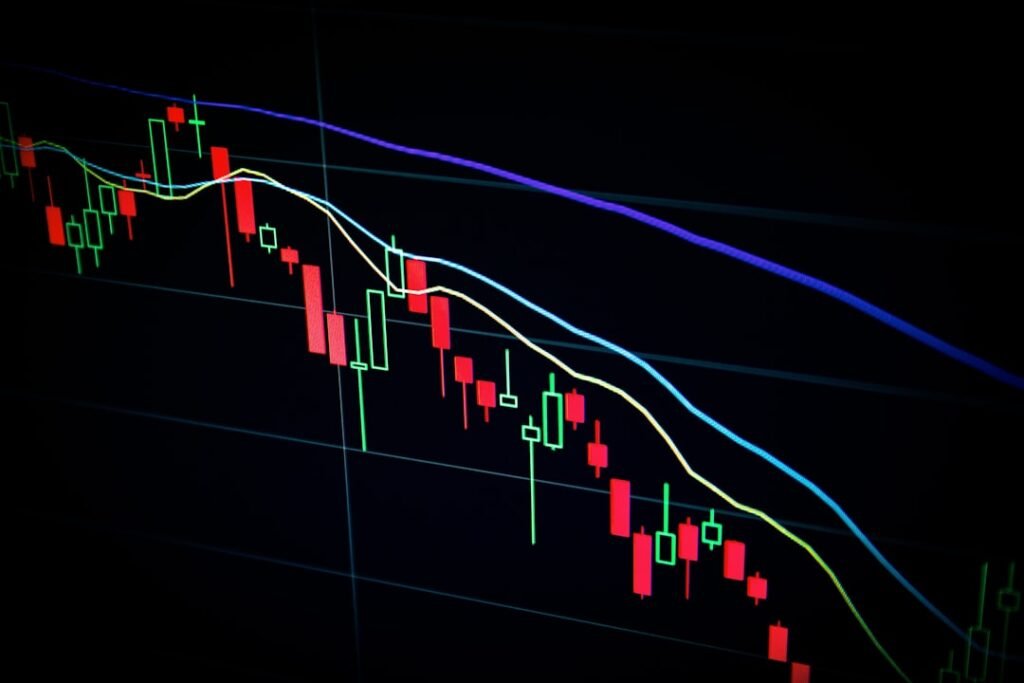
A common misconception is that price touching the upper band is automatically a sell signal, or that touching the lower band is a buy signal. In strong trends, price can “walk” along the upper or lower band for extended periods without reversing. During a strong uptrend, repeated closes near or above the upper band signal momentum strength — not overbought conditions in the traditional sense. Fading these touches without trend confirmation is one of the fastest ways to accumulate losses in a trending market.
Mean Reversion Setups
In ranging, low-trend markets, Bollinger Bands do work well as a mean-reversion tool. When price spikes to the outer bands and then forms a reversal candlestick pattern (such as a pin bar or engulfing candle), traders look for a return toward the middle band (the 20 SMA). This setup is most reliable when the overall trend is flat, confirmed by a flat middle band, and when the spike to the outer band is accompanied by a momentum divergence on an indicator like RSI or MACD.
A practical example: In a flat, sideways market, price drops to the lower band with a long lower wick candle on declining bearish momentum (RSI rising while price is still at the low). This confluence suggests the selling pressure is exhausted, and a move back to the middle band is plausible — not guaranteed, but statistically meaningful.
Common Mistakes Traders Make with Bollinger Bands
1. Using Them in Isolation
Bollinger Bands describe volatility and relative price position. They are not a complete trading system on their own. Pairing them with a trend filter (such as a higher-timeframe moving average), a momentum oscillator (RSI, Stochastics), or volume analysis dramatically improves signal quality.
2. Treating Band Touches as Automatic Reversals
As discussed, this fails in trending markets. Always check whether the market is ranging or trending before deciding how to interpret a band touch. A simple ADX reading can help here — readings above 25 generally indicate a trending environment where mean-reversion logic is less reliable.
3. Ignoring the Middle Band
The 20-period SMA at the center of the bands is often underutilized. In a trending market, the middle band acts as dynamic support or resistance. Price pulling back to this level and holding can be a high-probability entry in the direction of the trend — a point many traders overlook while watching only the outer bands.
4. Changing Settings Too Frequently
Constantly adjusting Bollinger Band settings to match recent price behavior is a form of curve-fitting. Choose settings that are appropriate for your instrument and timeframe, test them thoroughly, and stick with them consistently. Chasing the “perfect” setting is a trap that leads to inconsistent results.
Putting It All Together
Bollinger Bands become genuinely powerful when used as part of a broader analytical framework. Identify whether the market is trending or ranging, confirm signals with at least one complementary indicator, and treat band touches as areas of interest rather than automatic triggers. Respect the squeeze as a volatility warning, walk-the-band behavior as trend strength, and band touches in flat markets as potential mean-reversion opportunities.
If you trade on MetaTrader and want to streamline how you apply Bollinger Band-based analysis, the custom indicators and Expert Advisors available at mghfx.com are worth exploring — several are designed to combine volatility signals with momentum filters, removing some of the manual guesswork from the process.
Disclaimer: This article is intended for educational purposes only and does not constitute financial or investment advice. Trading foreign exchange and other financial instruments carries substantial risk of loss and is not suitable for all investors. Always conduct your own research and consult a qualified financial professional before making trading decisions.
Photo by rc.xyz NFT gallery on Unsplash