Why Most Traders Pick a Side — And Why That Limits Them
In forex trading circles, you will often find two camps: traders who swear by charts, patterns, and indicators, and traders who follow economic data, central bank policy, and geopolitical events. Both approaches have genuine merit, but treating them as mutually exclusive is one of the most common mistakes retail traders make. The most consistent traders tend to use both lenses together — not alternately, but in a structured, complementary way.
This article explains what each discipline offers, where each falls short on its own, and how to build a practical framework that combines the two into a coherent trading process.
What Each Approach Actually Tells You
Fundamental Analysis: The “Why”
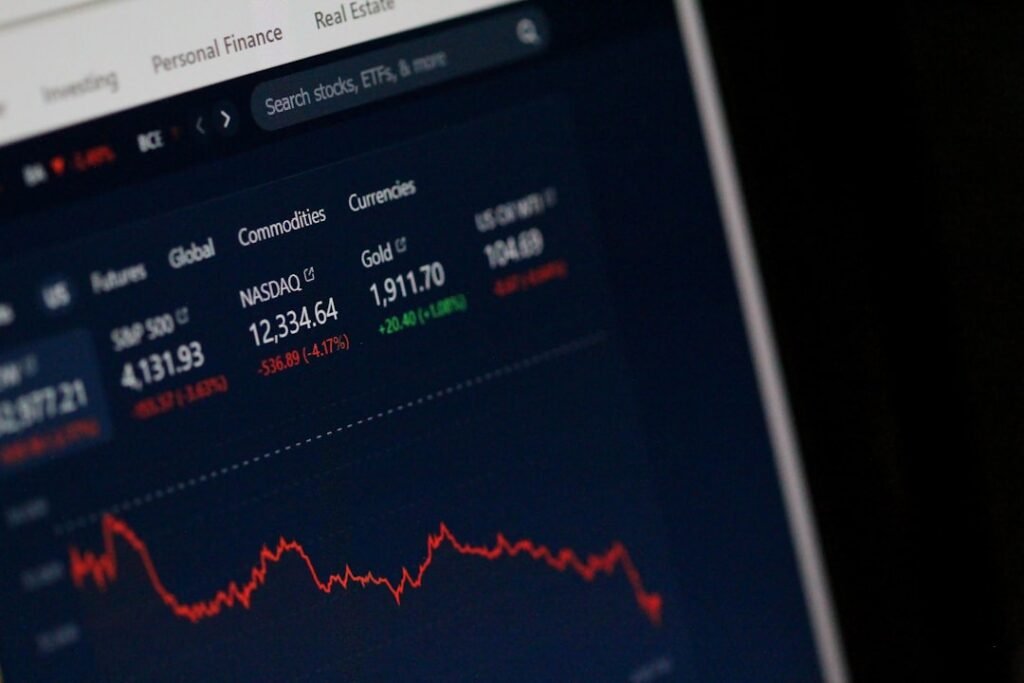
Fundamental analysis is concerned with the underlying forces that drive a currency’s value over time. This includes macroeconomic indicators such as GDP growth, inflation data, employment figures, and trade balances. It also encompasses central bank decisions — particularly interest rate policy — since interest rate differentials are one of the most powerful drivers of currency flows.
The core strength of fundamental analysis is that it explains why a market is moving or is likely to move. If a central bank signals a tightening cycle while a counterpart holds rates steady, the interest rate differential creates a logical, data-backed bias toward the higher-yielding currency. Fundamentals give you the big picture — the direction of the river, so to speak.
The weakness? Fundamentals are often slow-moving and imprecise in timing. Knowing that a currency is fundamentally strong does not tell you when to enter a trade, where price might stall, or how deep a pullback could go before the trend resumes.
Technical Analysis: The “When” and “Where”
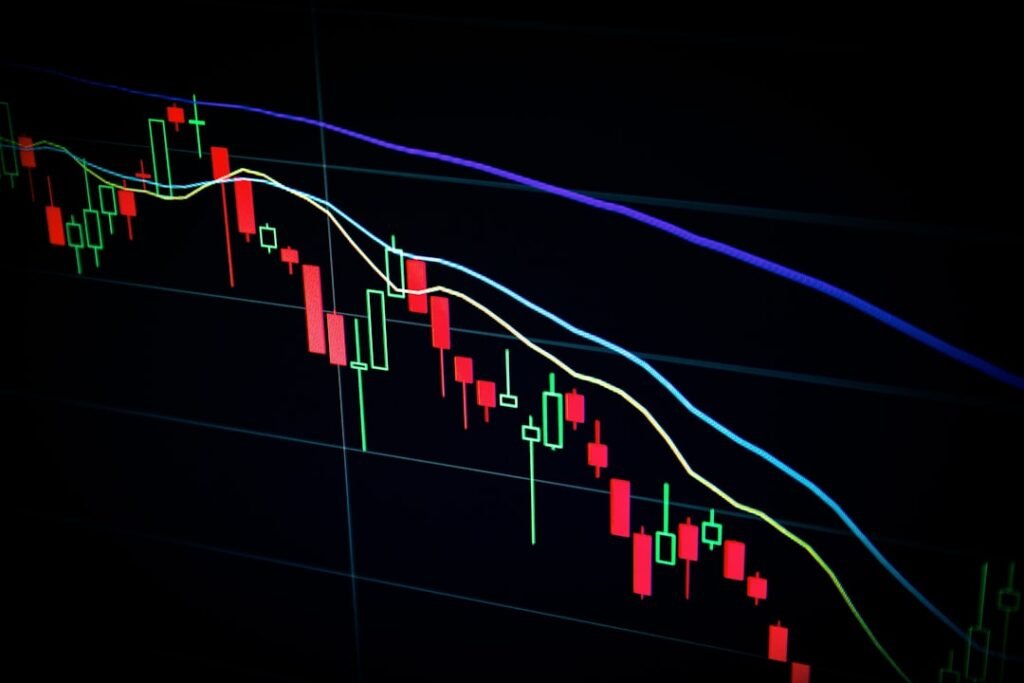
Technical analysis studies price action and volume on a chart to identify patterns, trends, support and resistance levels, and momentum. Tools range from simple trend lines and moving averages to oscillators like RSI or MACD, and price action concepts like candlestick formations or structure breaks.
The core strength of technical analysis is precision. It helps you identify specific entry points, logical stop-loss levels, and potential profit targets. A well-read chart can show you exactly where buyers and sellers have historically clashed, where trends have accelerated, and where reversals tend to begin.
The weakness? Technical analysis operates in isolation from context. A bullish chart pattern forming ahead of a major central bank announcement that turns out to be dovish can evaporate instantly. Price patterns are probabilistic, not deterministic — and ignoring the macro environment increases the odds of being caught on the wrong side of a fundamental shift.
A Practical Framework for Combining Both
Step 1 — Establish the Fundamental Bias
Begin your analysis at the macro level. Ask: what is the overall economic story for each currency in a pair? Is one country experiencing stronger growth, rising inflation, or a more hawkish central bank? Is there a meaningful interest rate differential? Do recent employment or trade figures support or contradict the prevailing narrative?
This step gives you a directional bias — a reason to favor one side of the market over a medium-to-long-term horizon. You are not looking for a precise entry here; you are simply asking, “All else being equal, which direction does the fundamental backdrop favor?”
Step 2 — Use Technicals to Time the Entry
Once you have a fundamental bias, move to the chart to look for technical setups that align with it. This is the key principle: you are not using technicals to find any trade — you are using them to find trades that agree with your fundamental view.
For example, suppose your fundamental analysis suggests a particular currency pair is in a broader uptrend driven by diverging monetary policy. On the daily or four-hour chart, you then wait for a pullback to a meaningful support zone — perhaps a prior structure level, a key moving average, or a Fibonacci retracement. When price reaches that zone and shows a bullish reversal signal (a rejection candle, a break of a short-term downtrend line), you have a technically timed entry that is backed by a fundamental reason to exist.
This combination dramatically improves the quality of your setups. You avoid buying into exhausted breakouts, and you avoid shorting into fundamentally strong trends simply because a short-term indicator looks overbought.
Step 3 — Use Fundamentals to Manage the Trade
The combination doesn’t end at entry. Fundamental events — scheduled releases like non-farm payrolls, inflation reports, or central bank meetings — can validate or invalidate your trade thesis mid-stream. If you are holding a position and a major report comes in strongly against your bias, that is a signal to reassess. Conversely, a report that confirms your fundamental view can give you the confidence to hold through normal technical noise rather than exiting prematurely.
Think of technicals as your map and fundamentals as weather conditions. A map tells you the route; conditions tell you whether the route remains viable.
Common Pitfalls to Avoid
- Confirmation bias: Don’t cherry-pick fundamentals that support a chart pattern you already want to trade. Run the fundamental analysis first, independently.
- Overcomplicating the process: You do not need every indicator and every data point. A clear macro narrative plus two or three reliable technical tools is more powerful than a cluttered approach.
- Ignoring event risk: Always be aware of scheduled high-impact releases around your trades. Even a technically perfect setup can be destroyed by an unexpected data shock.
- Mismatching timeframes: Fundamental biases often play out over weeks or months. Pair them with medium-term technical charts (daily, four-hour) rather than scalping timeframes where the fundamental picture is largely irrelevant.
For traders who want structured tools to support this process, MetaTrader indicators and Expert Advisors from mghfx.com can help automate parts of the technical side — screening for setups, tracking key levels, and managing entries — so you can focus more attention on the fundamental analysis that informs your overall bias.
Bringing It Together
Technical and fundamental analysis are not rivals — they answer different questions. Fundamentals tell you what the market has reason to do; technicals tell you when and where to act on that reason. Building a disciplined habit of running both before placing a trade will not eliminate losing positions, but it will dramatically reduce trades that have no business being taken in the first place. Start simple: form a macro view, find a technical alignment, and let the two reinforce each other before you risk capital.
Disclaimer: This article is for educational purposes only and does not constitute financial or investment advice. Trading forex involves significant risk, and you should consult a qualified financial professional before making any trading decisions.
Photo by Anne Nygård on Unsplash