The cross volume indicator is based on the overlap of the Tenkan-sen and Kijun-sen crosses, resulting in a histogram volume indicator.
Pass: www.mghfx.com
Strategy :
If multiple overlaps occur within a candle or range, there may be a possibility of a reversal in that area.
There are two types of strategies which can be adjusted from the settings :
- Based on the cross of Tenkan-sen and Kijun-sen.
- Based on Como Switch
How to use :
Each histogram candle displays a number indicating the amount of overlaps from the past on that particular candle.
Facilities :
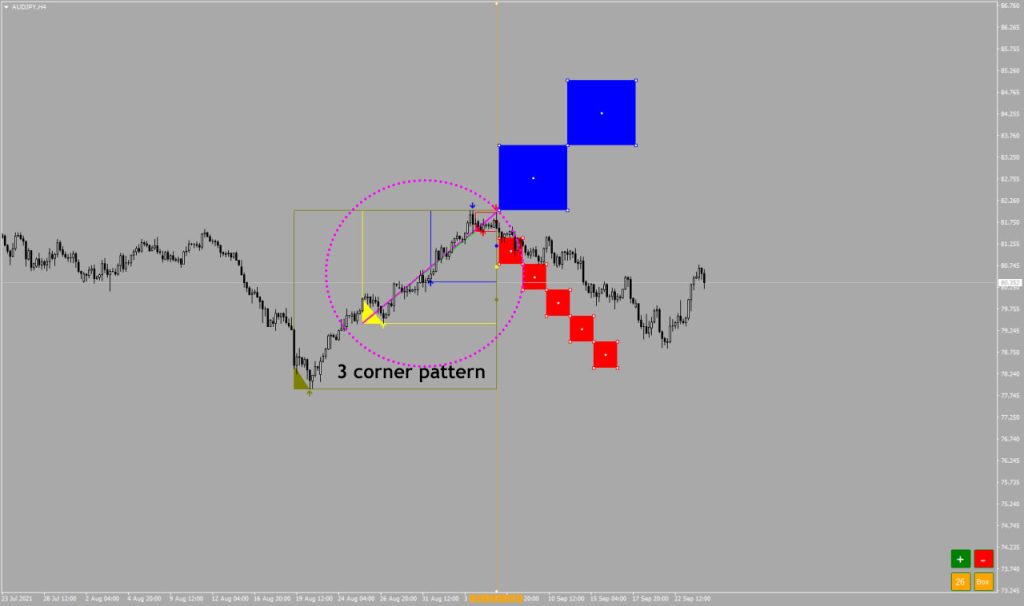
- You can use the “vline” button to draw a vertical line on the chart and move it to your desired location.
- Pressing the “crs” button allows you to see the overlapping lines with the Ichi number (or distance).
- Adding future candles to predict.
- Future candles can be added for prediction purposes.
- Overlapping Ichi numbers can be printed onto future candles.
- Ichi numbers are editable in the settings, allowing users to adjust the amount and number as needed.
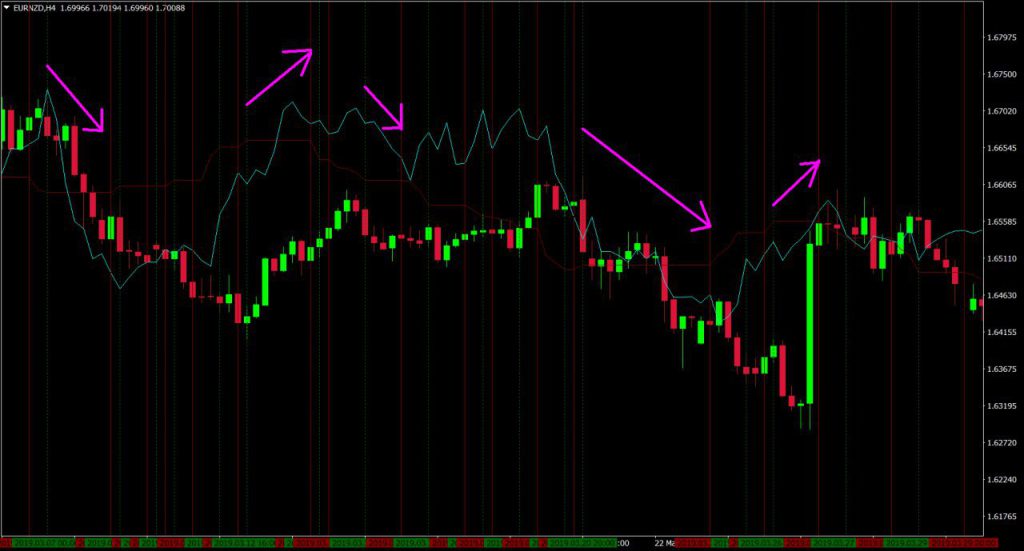
- Movement prediction lines for future Kumo, Tenkan, and Kijun lines are available.
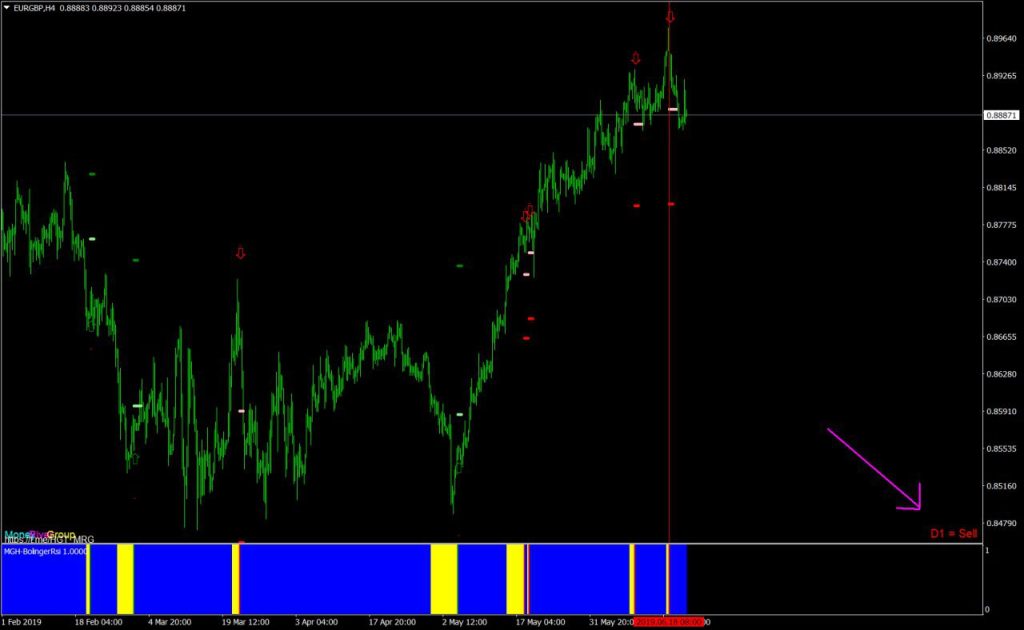
- There is an arrow symbol displayed on candles 9, 26, and 52.
- Overlapping numbers of past candles can be printed.