Why Support and Resistance Are the Foundation of Technical Analysis
Before any indicator, any oscillator, or any automated system enters the picture, price itself tells a story. Support and resistance levels are the chapter headings of that story — the places where buyers and sellers have repeatedly clashed, and where the market has shown its hand. Understanding how to identify genuinely significant levels, rather than drawing lines at every minor swing, is one of the most practical skills a forex trader can develop.
This guide walks you through what makes a support or resistance level truly high-probability, how to locate those levels systematically, and how to use them to structure smarter trade entries, exits, and stop placements.
What Support and Resistance Actually Represent
Support is a price zone where buying interest has historically been strong enough to halt a decline and push price back upward. Resistance is the mirror: a zone where selling pressure has consistently capped rallies. The key word is zone, not line. Price rarely reverses at a single pip — it reacts within a band, and treating these as areas rather than precise points leads to more realistic trade execution.
At their core, these levels represent collective trader psychology. A price that rejected sharply from a level months ago is remembered — by algorithms, by institutional order books, and by discretionary traders worldwide. That memory creates self-reinforcing behavior: the more a level has held, the more traders expect it to hold again, and the more orders cluster there.
How to Identify High-Probability Levels
1. Look for Multiple Touches with Clear Reactions
A single touch does not make a level significant. What you want to see is price visiting the same zone two or more times and reacting clearly each time — a sharp bounce off support, a strong rejection at resistance. Three or more touches with visible reactions elevate a level to high-priority status. The more tests a level survives, the more loaded it becomes with pending orders on the next approach.
2. Prioritize Higher Timeframe Levels
A resistance visible on the daily or weekly chart carries far more weight than one drawn on a 15-minute chart. Higher timeframes aggregate the decisions of more participants over a longer period. When you are trading on a lower timeframe, always zoom out first and identify the major levels on the daily and H4 charts — then drill down to find your entry. This top-down approach prevents the common mistake of placing trades that look clean on H1 but sit directly in front of a weekly resistance wall.
3. Watch for Role Reversal
One of the most reliable dynamics in technical analysis is the flip of support into resistance and vice versa. When a support level breaks convincingly, that same price zone often becomes a resistance on the next rally back up — and the reverse is equally true. This role reversal happens because traders who bought at the old support and are now underwater will use any rally back to that zone as an exit opportunity, creating fresh selling pressure. Identifying these flipped levels gives you a second-chance entry with a logical story behind it. If you are interested in catching those decisive breaks as they happen, the mechanics of breakout trading strategy build directly on this concept.
4. Use Confluence to Build Confidence
A level becomes significantly more powerful when multiple independent factors align at the same price zone. Examples of confluence include:
- A historical support/resistance level that also coincides with a key Fibonacci retracement (such as the 61.8% level)
- A round number (e.g., 1.1000 on EUR/USD) sitting at a prior swing high
- A moving average converging with a structural level on the same timeframe
- A level confirmed on both the weekly and daily charts
The more factors pointing to the same price zone, the higher the probability that the market will react meaningfully there.
Using Support and Resistance in Your Trading
Entries and Confirmation
Approaching a high-probability level is not, by itself, a reason to enter a trade. You need confirmation that the market is actually respecting the level before committing capital. This is where candlestick patterns become invaluable — a pin bar, engulfing candle, or inside bar forming right at a key level is a concrete signal that price has tested and rejected the zone. Waiting for this confirmation costs you a few pips of entry precision but dramatically improves your win rate by filtering out false setups.
For traders who prefer a cleaner, indicator-free approach, price action trading integrates seamlessly with support and resistance — the two concepts are essentially the same discipline viewed from different angles.
Stop Losses and Targets
Support and resistance levels also provide a logical framework for stop placement. If you buy at support, your stop should sit below the level — not at it, but a comfortable distance beneath the zone to allow for normal price noise without being triggered by a brief wick. The target, conversely, is the next resistance level above. This gives you a clear risk-to-reward ratio before the trade is placed, which is the hallmark of disciplined trading.
When a level is strong enough to act as a significant target, consider scaling out of the position as price approaches it rather than waiting for a complete breakout — many moves stall and reverse exactly at these zones before eventually pushing through.
Combining with Trend Context
Support and resistance do not exist in isolation. A support level that forms in a strong uptrend carries a very different probability than one forming in a confirmed downtrend. In an uptrend, buying bounces off support aligns with the dominant market direction and tends to produce the highest-quality setups. In a downtrend, shorting rejections from resistance is the higher-probability play. Understanding trend following strategies alongside support and resistance gives you both the map and the compass.
Practical Tips for Cleaner Level Identification
- Use the body of candles, not just the wicks. Wicks show intraday extremes; candle bodies show where price actually closed and spent time. Major levels often sit at the tops and bottoms of candle bodies, not wick tips.
- Fewer levels, cleaner chart. Draw only the levels that would cause you to act. A chart cluttered with twenty lines teaches you nothing; three well-chosen levels teach you everything.
- Mark zones, not lines. Use a rectangle or shaded zone to represent the area between the highest and lowest touches, rather than a single flat line.
- Review and update regularly. Levels that were relevant six months ago may no longer be. After major moves, re-evaluate your chart from scratch to identify the new key zones.
Putting It All Together
Support and resistance trading is not complicated — but it does demand patience, discipline, and a genuine respect for what the chart is telling you. The traders who profit from these levels consistently are not the ones drawing the most lines; they are the ones who wait for the cleanest confluences and demand confirmation before acting.
If you want to automate the scanning and plotting of key levels across multiple pairs and timeframes, the MetaTrader indicators available at mghfx.com can help you work more efficiently without changing the core method.
Disclaimer: This article is for educational purposes only and does not constitute financial or investment advice. Trading forex carries significant risk, and you should only trade with capital you can afford to lose.
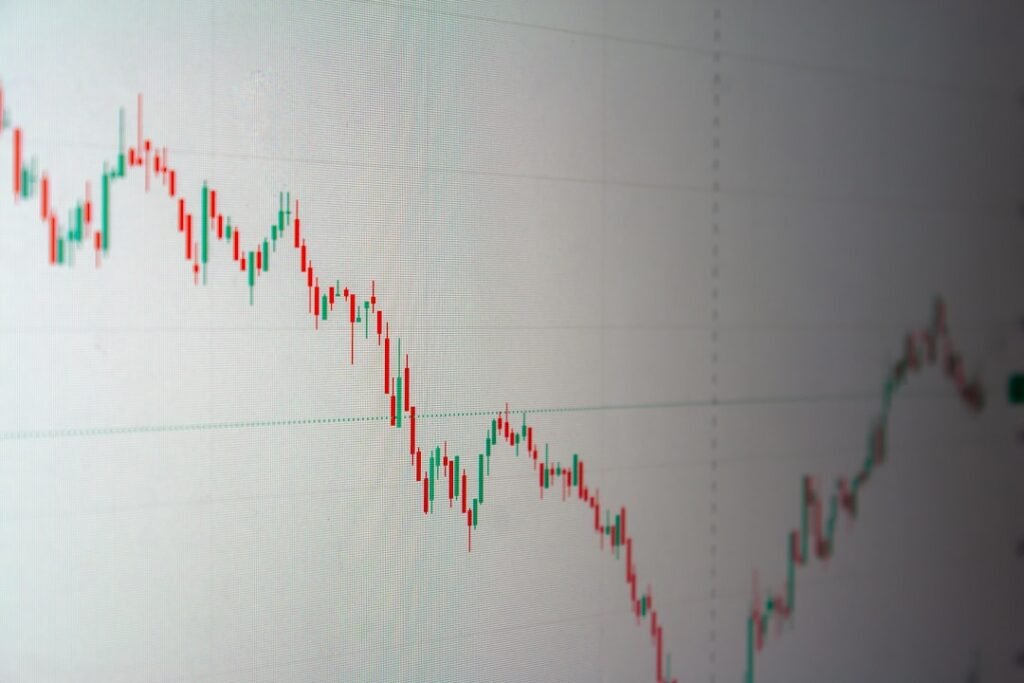
Photo by Yashowardhan Singh on Unsplash