What Is the Average True Range (ATR)?
The Average True Range, universally known as ATR, is a technical indicator developed by J. Welles Wilder Jr. and introduced in his 1978 book New Concepts in Technical Trading Systems. Unlike most indicators that try to predict price direction, ATR does something more fundamental: it measures how much a market is moving, regardless of which way it moves. In other words, ATR quantifies volatility.
This distinction matters enormously. A trader who understands current volatility can set smarter stop-losses, size positions more responsibly, and recognize when a market is coiling for a breakout versus grinding sideways. ATR is one of the few indicators that belongs in virtually every serious trader’s toolkit.
How ATR Is Calculated
To understand ATR, you first need to understand its building block: the True Range (TR). For any given period (usually a single candle), the True Range is the largest of these three values:
- Current high minus current low
- Absolute value of current high minus previous close
- Absolute value of current low minus previous close
The reason Wilder included the previous close is to account for gaps. If a market closes at 1.2000 and opens the next session at 1.2080, a simple high-minus-low calculation would miss that 80-pip overnight gap entirely. By referencing the prior close, True Range captures the full extent of price movement between periods.
Once you have a series of True Range values, ATR is simply a smoothed moving average of those values — Wilder originally used a 14-period smoothing, which remains the default on virtually every platform. A 14-period ATR on a daily chart, for example, reflects approximately two and a half weeks of average daily range.
A Simple Example
Suppose EUR/USD has printed True Range values averaging around 80 pips over the last 14 days. The ATR reads 80. If the pair suddenly starts printing 140-pip days, the ATR will rise to reflect that expanded volatility. If the market quiets down to 40-pip sessions, ATR will contract accordingly. The indicator is always telling you the same thing: how much this market has been moving per candle, on average.
Practical Uses of ATR in Trading
1. Setting Intelligent Stop-Losses
One of the most powerful applications of ATR is placing stop-losses at a distance the market actually needs to breathe. A common approach is to set stops at 1× to 2× ATR away from your entry point.
Why does this matter? If a market has an ATR of 100 pips and you place a 20-pip stop, you are almost guaranteed to be stopped out by random noise — the ordinary fluctuation of the market — before your trade has any real chance to develop. Conversely, ATR-based stops expand automatically during high-volatility periods and contract during quiet ones, keeping your risk proportionate to market conditions at all times.
2. Position Sizing and Risk Management
ATR is equally valuable for position sizing. A straightforward formula used by many professional traders works like this: decide the fixed dollar amount you are willing to risk on a trade, then divide that by the ATR value (converted to the account’s currency). The result tells you the appropriate position size for that specific market condition.
For example, if you risk $200 per trade and the ATR represents $150 worth of movement per contract, you would trade approximately 1.3 contracts. During a high-volatility period where ATR doubles to $300, the same formula automatically reduces your position size, keeping risk consistent. This is sometimes called volatility-adjusted position sizing, and it is one of the most robust risk management frameworks available to retail traders.
3. Identifying Breakout Potential
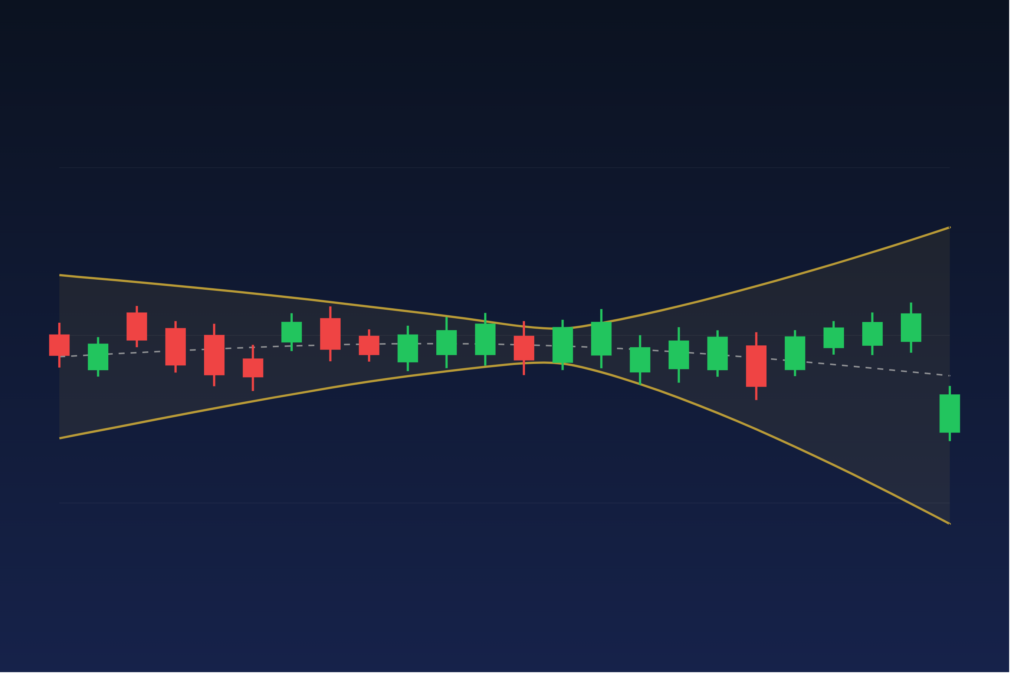
ATR also works well as a context filter for breakout strategies. When ATR is unusually low relative to its historical average, it signals that the market is consolidating and compressing energy. Many significant trending moves begin after a period of contracted volatility. Conversely, when ATR is very high, it often means a move is already well underway, and chasing it carries greater risk.
A practical rule: look for ATR readings in the lower portion of their historical range as a warning that a breakout may be near, and treat high ATR readings as a signal to be cautious about entries rather than exits.
4. Trailing Stops with ATR
Traders who want to ride trends without surrendering too much profit often build ATR-based trailing stops. A common approach is to trail your stop at 2× or 3× ATR below price in an uptrend (or above in a downtrend), updating it as each new candle closes. This keeps the stop wide enough to survive normal pullbacks while still locking in gains as the trend matures. Many systematic traders and EA developers encode this logic directly into their trading algorithms.
ATR’s Limitations
ATR is a lagging indicator — it reflects what volatility has been, not what it will be. A sudden news event can render the current ATR temporarily meaningless. Additionally, ATR tells you nothing about direction; it must always be paired with price action analysis, trend tools, or other indicators to build a complete trading approach.
It is also worth noting that ATR values are expressed in the same unit as price — pips for forex pairs, dollars for commodities — so they are not directly comparable across different instruments. An ATR of 200 means something very different on USD/JPY than it does on a currency pair trading at much lower prices.
Putting ATR to Work
ATR earns its place as a foundational volatility tool because it solves real problems: stops that actually fit the market, position sizes that stay proportionate to risk, and contextual clues about whether the market is sleeping or waking up. Used thoughtfully, it can make every other element of your strategy more precise.
If you trade on MetaTrader 4 or 5, ATR is built into the platform, but combining it with well-designed indicators and Expert Advisors can automate much of this logic. The tools available at mghfx.com are built with volatility-aware logic in mind, which can help traders apply ATR-based concepts consistently without manual calculation on every trade.
Disclaimer: This article is for educational purposes only and does not constitute financial or trading advice. Trading forex and CFDs involves significant risk of loss and is not suitable for all investors. Always conduct your own research and consider your financial situation before trading.