What Is the Parabolic SAR?
The Parabolic SAR (Stop and Reverse) is a technical indicator developed by J. Welles Wilder Jr., the same analyst behind the RSI and Average True Range. Designed specifically to track price direction and highlight potential reversal points, the Parabolic SAR plots a series of dots either above or below price on a chart. Its visual simplicity is deceptive — underneath it lies a dynamic formula that accelerates as a trend matures, making it one of the more nuanced trend-following tools available to retail traders.
The name itself tells the story: parabolic refers to the curved, accelerating path the dots trace over time, and SAR stands for Stop and Reverse — because the indicator was originally designed to signal not just where to exit a trade, but where to immediately enter one in the opposite direction.
How the Parabolic SAR Is Calculated
You don’t need to calculate the Parabolic SAR by hand — MetaTrader handles it automatically — but understanding its mechanics helps you use it with confidence rather than blind faith.
The indicator relies on three core components:
- EP (Extreme Point): The highest high in an uptrend, or the lowest low in a downtrend, recorded during the current trend phase.
- AF (Acceleration Factor): A multiplier that starts at a default value of 0.02 and increases by 0.02 each time a new EP is recorded, up to a maximum of 0.20.
- SAR Value: Calculated as the previous SAR value plus AF multiplied by the difference between EP and the previous SAR.
The key insight here is the acceleration factor. Early in a trend, the dots move slowly and stay well away from price. As the trend extends and the EP is repeatedly exceeded, the AF steps up, pulling the SAR dots closer and closer to price. This means the indicator naturally tightens its trailing stop as a trend ages — a built-in reflection of increasing risk as momentum potentially peaks.
Reading Parabolic SAR Signals
Dots Below Price: Bullish Bias
When the SAR dots appear below the current candles, the indicator is signaling a bullish phase. Price is above the dots, and the dots serve as a rising trailing stop. As long as price does not close below the SAR level, the bullish signal remains intact. Traders often use this configuration to manage long positions, moving their stop loss up in line with each new SAR dot.
Dots Above Price: Bearish Bias
When the dots flip to above the candles, the indicator has reversed and is signaling a bearish phase. Price is now below the dots, and the indicator trails downward. This configuration supports short positions or at minimum signals that long trades should be reconsidered.
The Flip: Where the Signal Occurs
The most actionable moment in Parabolic SAR analysis is the flip — the bar on which the dots switch from one side of price to the other. A flip from above to below signals a potential shift to bullish momentum. A flip from below to above signals a potential shift to bearish momentum. Because the SAR is a reversal indicator by design, each flip is not just an exit signal but a theoretical entry signal in the new direction.
For example, imagine a currency pair that has been in a steady downtrend for several weeks. The SAR dots have been plotting above price consistently. Then, on a strong bullish candle, the dots drop below price for the first time. That flip is the indicator telling you the trend structure has potentially changed — worth examining in context with other tools.
Practical Limitations and How to Use SAR Wisely
Parabolic SAR Struggles in Ranging Markets
The Parabolic SAR’s greatest weakness is its performance in sideways, choppy, or consolidating markets. Because the indicator is always either bullish or bearish (there is no neutral state), it will generate frequent and often false flips when price is ranging within a tight band. Traders who apply the SAR mechanically in these conditions tend to get whipsawed repeatedly — entering just as price reverses back through the midpoint of the range.
The practical solution is to combine the Parabolic SAR with a trend filter. Common approaches include:
- Using a moving average to confirm the overall direction before acting on SAR flips
- Applying ADX (Average Directional Index) to measure trend strength — only taking SAR signals when ADX is above a threshold like 25
- Checking higher timeframe structure to ensure SAR signals on lower timeframes align with the dominant direction
Adjusting the Acceleration Factor
Most platforms allow you to modify the starting AF and maximum AF values. A lower starting AF (such as 0.01) makes the indicator less sensitive and produces fewer but potentially more reliable signals. A higher starting AF increases sensitivity and keeps tighter stops but also generates more noise. Testing different settings on the instruments and timeframes you trade is worthwhile before committing to defaults.
Using SAR as a Trailing Stop Tool
One of the most practical applications of the Parabolic SAR is not as an entry trigger, but as a dynamic trailing stop. Rather than setting a static stop loss, a trader can place their stop at the current SAR level and update it manually as each new bar forms. This approach lets winning trades run while the automatic acceleration of the indicator progressively tightens risk as the trend matures — a disciplined, rule-based way to manage exits without second-guessing.
Putting It All Together
The Parabolic SAR is a genuinely useful tool when applied with an understanding of its strengths and limitations. It excels in trending environments, provides clear visual signals, and offers a logical basis for trailing stop management. It struggles when markets are flat, and it rewards traders who pair it with complementary indicators rather than relying on it in isolation.
For traders who want to explore these concepts inside MetaTrader with purpose-built tools, MGH Products at mghfx.com offers a range of indicators and Expert Advisors designed to help structure and automate trend-following approaches like this one.
Disclaimer: This article is for educational purposes only and does not constitute financial or trading advice. All trading involves risk. Always conduct your own analysis before making any trading decisions.
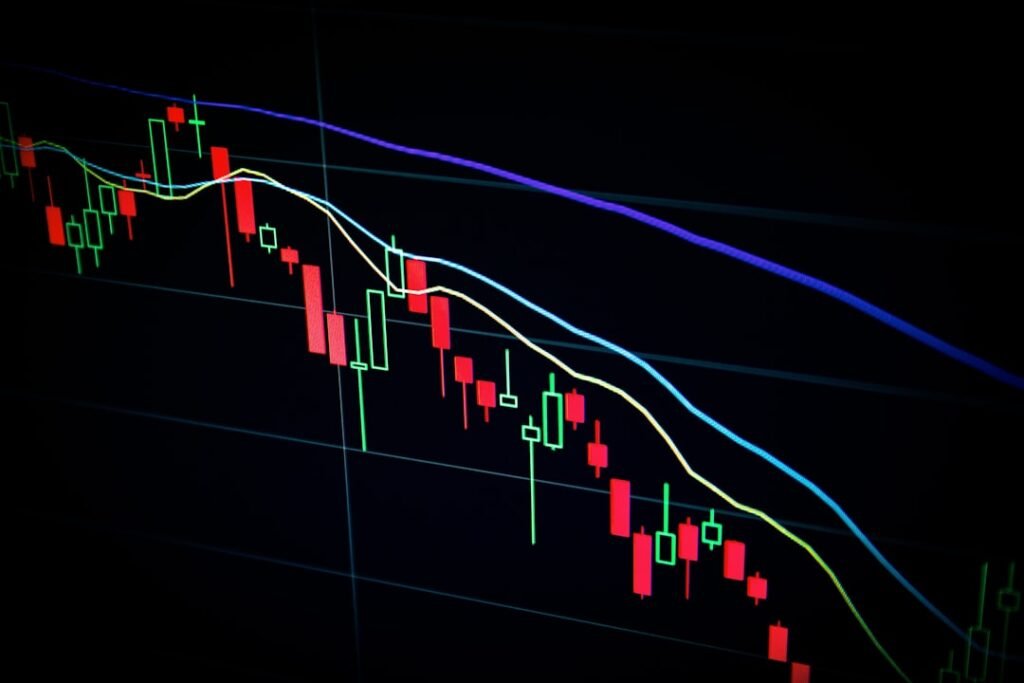
Photo by Maxim Hopman on Unsplash