What Are Donchian Channels?
Donchian Channels are one of the oldest and most straightforward trend-following tools in technical analysis. Developed by commodity trader Richard Donchian in the mid-twentieth century, the indicator plots three lines on a price chart: an upper band representing the highest high over a defined lookback period, a lower band representing the lowest low over the same period, and a middle line that is simply the average of the two.
The logic behind the indicator is elegantly simple: if price is pushing above recent highs, something has changed — buyers are more aggressive than they have been in weeks. If price is falling below recent lows, sellers have taken control. These events are called breakouts, and Donchian Channels are specifically designed to highlight them.
The most common default setting is a 20-period lookback, which captures roughly four weeks of daily price action. However, traders adjust this period depending on their timeframe and style — shorter periods (10–14) produce more frequent, noisier signals, while longer periods (50–55) filter out noise and target only significant trend moves.
Reading the Three Bands
The Upper Band: Bullish Breakout Zone
The upper band marks the highest price reached during the lookback window. When a candle closes above this band, it means price has just made a new N-period high. In breakout trading, this is treated as a bullish signal — the market is doing something it has not done in the recent past, which often precedes a sustained move higher.
Imagine a currency pair that has traded in a tight range for three weeks. Its Donchian upper band sits at a fixed level reflecting the top of that range. The moment price closes above that band, the channel expands upward, visually confirming the breakout. Traders watching this signal interpret it as the beginning of potential trend continuation or a fresh trend entirely.
The Lower Band: Bearish Breakout Zone
The lower band works in the opposite direction. A close below the lower band signals that price has reached a new N-period low — a bearish breakout. This can indicate the start of a downtrend or an acceleration of an existing one.
A useful rule of thumb borrowed from Richard Donchian’s own system: enter long on a break of the upper band, exit or go short on a break of the lower band. While this mechanical approach will not suit every trader’s style, it captures the core concept well.
The Middle Line: Dynamic Support and Resistance
The middle line — the midpoint between the upper and lower bands — acts as a dynamic reference level. In a trending market, price often pulls back to the middle line before continuing in the trend direction. Some traders use it as a trailing stop reference or as a re-entry zone after an initial breakout.
Practical Breakout Strategies Using Donchian Channels
The Classic Channel Breakout Entry
The most direct application is straightforward:
- Wait for price to close beyond the upper or lower band.
- Enter in the direction of the breakout on the next candle open.
- Place your stop-loss just inside the opposite band, or at a recent swing point.
- Target a risk-to-reward ratio of at least 1:2, using the channel width as a guide to volatility.
This approach works best in trending markets. In choppy, sideways conditions, false breakouts — where price briefly pierces a band and then reverses — are more common. This is why many traders combine Donchian Channels with a trend filter such as a longer-period moving average to identify trend strength: only take long breakouts when price is above the 200-period MA, and short breakouts when it is below.
Using Channel Width to Gauge Volatility
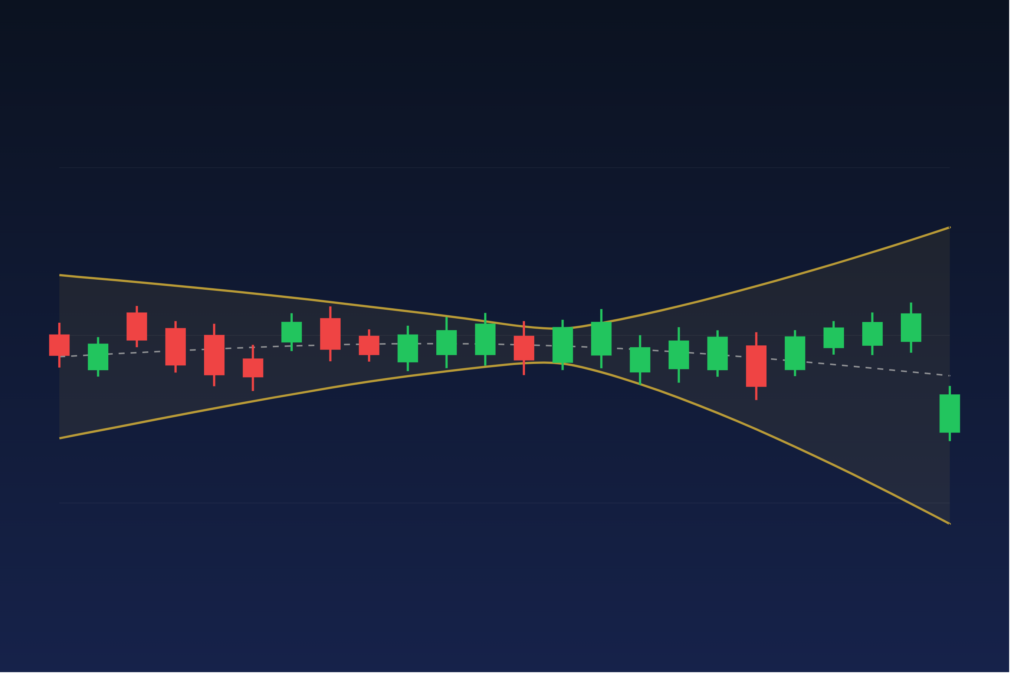
The distance between the upper and lower bands is a direct measure of recent volatility. A narrow channel means price has been moving in a tight range — periods of compression that often precede explosive moves. A wide channel reflects high volatility and suggests that any new breakout carries more momentum but also more risk.
Traders who understand this use a narrow channel as a setup condition: wait for the bands to compress, then prepare for a breakout entry. This concept is similar to the Bollinger Band squeeze but applied through a pure price-high/low lens rather than a standard deviation calculation.
Donchian Channels on Multiple Timeframes
A powerful refinement is to align timeframes. For example, use a 20-period Donchian Channel on the daily chart to identify the primary trend direction, then drop to a four-hour chart to time a more precise entry near the channel midline or on a smaller-timeframe breakout. This multi-timeframe approach reduces the number of trades but tends to improve their quality.
Common Pitfalls to Avoid
- Chasing breakouts in ranging markets: Donchian Channels shine in trending environments. If a currency pair has been ranging for months, breakout signals will frequently fail. Always assess the broader market context first.
- Ignoring volume or momentum confirmation: A breakout accompanied by strong momentum (visible in an RSI push or an expanding ATR) is generally more reliable than one that creeps past the band on low energy.
- Over-optimizing the lookback period: Fitting the period to past data too precisely creates strategies that work on history but fail going forward. Stick to widely-used settings and test them robustly across different market conditions.
- No stop-loss discipline: Because Donchian breakouts can reverse sharply, clear stop placement is essential. The channel itself provides natural reference points for this.
Traders who want to automate or systematize their use of Donchian Channels alongside complementary indicators in MetaTrader may find that purpose-built indicators and Expert Advisors — such as those available at mghfx.com — can help apply these rules consistently without the emotional interference that manual trading often introduces.
Putting It All Together
Donchian Channels succeed because they are built on an objective truth: new highs and new lows mean something. They strip away the noise and ask one simple question — has price gone somewhere it has not been recently? When the answer is yes and the broader context supports it, that event deserves attention.
Whether you use them as a standalone breakout system or as a filter within a broader strategy, Donchian Channels offer a clean, rules-based framework that suits both discretionary and systematic traders. Master the basics, combine them thoughtfully with complementary tools, and practice consistent risk management — and this decades-old indicator will continue to earn its place on your charts.
Disclaimer: This article is intended for educational purposes only and does not constitute financial or investment advice. Trading forex and CFDs carries significant risk. Always conduct your own research and consider your risk tolerance before making any trading decisions.
Photo by Vladislav Maslow on Unsplash