What Are Moving Averages?
Moving averages are among the most widely used tools in technical analysis, and for good reason — they cut through the noise of random price fluctuations and reveal the underlying direction of a market. At their core, a moving average calculates the average closing price of an instrument over a defined number of periods, then plots that value as a line on the chart. As new price data arrives, the oldest data point is dropped and the average shifts forward — hence the word moving.
Traders use moving averages to identify trend direction, gauge momentum, and locate potential support and resistance levels. They are also a foundational component inside more complex indicators and automated strategies. Before applying them effectively, it helps to understand the two most common types: the Simple Moving Average (SMA) and the Exponential Moving Average (EMA).
SMA vs. EMA: Understanding the Difference
The Simple Moving Average (SMA)
The SMA gives equal weight to every closing price within the look-back period. To calculate a 20-period SMA, you add the closing prices of the last 20 candles and divide by 20. The result is straightforward and easy to verify manually.
Because it weights all periods equally, the SMA is smoother and slower to react to recent price changes. This makes it useful for identifying longer-term trend direction without overreacting to short-term spikes. A common application is the 200-period SMA, which many traders watch on daily charts to determine whether price is in a broadly bullish or bearish environment.
Example: If a currency pair has been trading above its 200-period SMA for several months, many traders interpret that as a sign the long-term trend is upward, and they look for buy setups rather than shorts.
The Exponential Moving Average (EMA)
The EMA applies a multiplier that gives greater weight to the most recent closing prices. The exact weighting formula uses a smoothing factor: 2 ÷ (n + 1), where n is the number of periods. This means a 10-period EMA reacts much faster to new information than a 10-period SMA would.
Because of this responsiveness, the EMA is popular among shorter-term traders and those who want an earlier signal when a trend begins to shift. The trade-off is sensitivity — the EMA will also react faster to false breakouts and temporary pullbacks, which can generate more noise.
Example: On a 1-hour EUR/USD chart, a 9-period EMA will hug price closely and flip direction quickly after a sharp move. A 9-period SMA on the same chart will lag behind, confirming the move later but with fewer whipsaws.
Which One Should You Use?
There is no universally correct answer. Many experienced traders use both simultaneously — a faster EMA for timing entries and a slower SMA for gauging the broader trend context. The key is consistency: pick settings that align with your trading style and test them thoroughly before committing real capital.
How Traders Apply Moving Averages in Practice
Trend Direction and Slope
The simplest use of a moving average is reading its slope. A rising moving average suggests bullish momentum; a falling one suggests bearish momentum. Many traders will only look for long (buy) positions when a key moving average is pointing upward, and short (sell) positions when it is pointing downward. This filter alone can reduce counter-trend trades that fight the prevailing momentum.
The Moving Average Crossover
One of the most well-known strategies involves two moving averages of different lengths. When the shorter (faster) average crosses above the longer (slower) average, it is called a golden cross — traditionally interpreted as a bullish signal. The opposite, where the faster average crosses below the slower, is called a death cross — a bearish signal.
Common pairings include:
- 9 EMA and 21 EMA — used by short-term intraday traders
- 50 SMA and 200 SMA — widely followed on daily charts for medium-to-long-term signals
- 20 EMA and 50 EMA — a popular middle-ground for swing traders
Crossover strategies work well in trending markets but can produce many false signals during sideways, choppy conditions. Combining crossovers with a momentum filter — such as RSI or MACD — can help reduce low-quality signals.
Dynamic Support and Resistance
Moving averages frequently act as dynamic support and resistance levels. During an uptrend, price often pulls back to a key moving average before bouncing higher. During a downtrend, rallies tend to stall when price reaches the moving average from below.
The 20 EMA, 50 SMA, and 200 SMA are particularly respected in this role because so many traders are watching them simultaneously — creating a self-reinforcing effect. A clean pullback to the 50 SMA in an established uptrend, for instance, is a setup many swing traders actively watch for.
Choosing the Right Period
Period selection should reflect your timeframe and trading style. Shorter periods (8–21) are more appropriate for scalping and day trading, providing responsive signals. Medium periods (20–50) suit swing traders looking at 4-hour or daily charts. Longer periods (100–200) are better suited for position traders assessing macro trend direction. Avoid the trap of endlessly optimizing periods to fit historical data — choose logical values and focus on how the average behaves with price structure.
Putting It All Together
Moving averages are not magic — they are lagging indicators by nature, meaning they confirm rather than predict price movement. Their real value lies in helping traders stay on the right side of a trend, define logical areas of interest, and build rule-based approaches to entry and exit. Used alongside price action, volume, or other indicators, they become significantly more powerful.
For traders who prefer a structured, rule-based environment, purpose-built MetaTrader indicators and Expert Advisors at mghfx.com include tools that incorporate moving average logic into clear visual signals and automated workflows — worth exploring if you want to apply these concepts without manual calculation on every chart.
The best approach is to start simple: pick one or two moving averages, understand exactly what they measure, and observe how price interacts with them across different market conditions. Mastery of a simple tool used consistently will outperform a complicated system that is only partially understood.
Disclaimer: This article is for educational purposes only and does not constitute financial or investment advice. Trading involves significant risk of loss. Always conduct your own research and consult a qualified financial adviser before making any trading decisions.
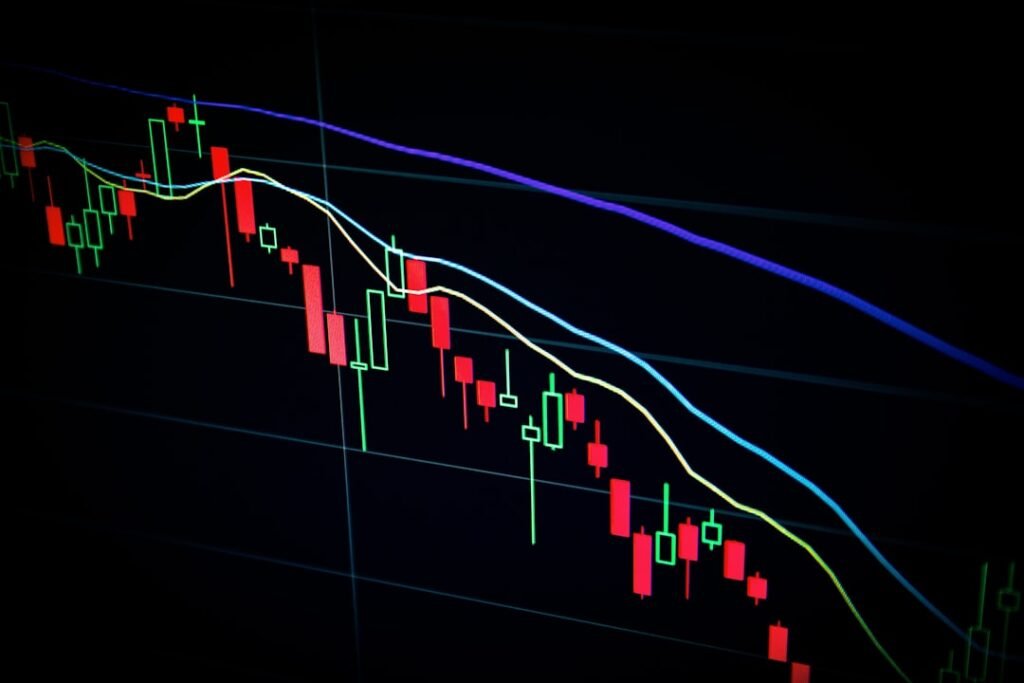
Photo by Kanchanara on Unsplash