The Volume Problem in Forex
Forex is a decentralized, over-the-counter market. Unlike the New York Stock Exchange, there is no central exchange recording every transaction. This leads many traders to dismiss volume analysis entirely, asking: if you cannot measure true volume, what is the point?
The answer is more nuanced than a simple yes or no. While it is true that no retail forex platform can show you the complete global volume for a currency pair, what MetaTrader and similar platforms do provide is tick volume — the number of price changes (ticks) that occur within a given time period. Research and years of practitioner experience consistently show that tick volume correlates strongly with real traded volume, particularly for major pairs. In other words, when price is moving frequently, large players are almost certainly active. That signal is genuinely useful.
How Volume Indicators Work in Forex
Volume indicators do not predict direction on their own. Instead, they measure the conviction behind a price move. High volume on a breakout suggests institutional participation and follow-through. Low volume on a rally raises a red flag — the move may be fragile. Understanding this principle is the foundation of all volume-based analysis.
Tick Volume vs. True Volume
Tick volume counts how many times price updates within a candle. A one-minute candle with 300 ticks reflects significantly more market activity than one with 30 ticks. Studies comparing broker tick data against actual interbank volume have found correlations above 90% for major pairs like EUR/USD and GBP/USD. The signal degrades somewhat for exotic pairs and during thin liquidity sessions, so always factor in the trading session when interpreting volume.
On-Balance Volume (OBV)
OBV, developed by Joe Granville, is a cumulative indicator. When price closes higher than the previous candle, the period’s volume is added to a running total. When it closes lower, volume is subtracted. The resulting line reveals whether volume is flowing into or out of a position overall.
In forex, OBV using tick volume can be effective at spotting divergences. If price is making new highs but OBV is flat or declining, sellers may be absorbing the buying pressure — a classic warning sign. Conversely, rising OBV during a consolidation phase suggests accumulation before a potential breakout.
Money Flow Index (MFI)
The Money Flow Index combines price and volume into a bounded oscillator, ranging from 0 to 100. It is sometimes called a volume-weighted RSI. Readings above 80 suggest overbought conditions supported by heavy volume; readings below 20 suggest oversold conditions. Because it incorporates volume, MFI tends to generate fewer false signals than a pure price oscillator like RSI in high-activity market conditions.
For example, if EUR/USD rallies sharply into a resistance zone but MFI drops below 50, it indicates that the volume supporting the push is weakening — a potential short setup when combined with a price pattern like a bearish engulfing candle.
Volume Spread Analysis (VSA)
Volume Spread Analysis examines the relationship between the candle’s range (spread) and its volume. A wide-spread candle on very low volume is called an effort versus result mismatch — price moved a lot, but few players were involved, suggesting a lack of conviction. A narrow-spread candle on extremely high volume suggests that smart money absorbed an attempted move — another warning sign of a potential reversal. VSA is more interpretive than OBV or MFI but offers a deeper look at supply and demand dynamics.
Practical Tips for Using Volume Indicators
- Combine with price action: Volume alone rarely gives a complete picture. A breakout confirmed by a surge in tick volume is far more reliable than one on flat volume.
- Watch for divergence: Price and volume moving in opposite directions is one of the most powerful signals volume analysis offers. Price making higher highs while volume makes lower highs is a classic bearish divergence.
- Account for session timing: Volume in forex is session-dependent. The London-New York overlap produces the highest tick volume for major pairs. A spike in volume during the Asian session carries less weight than an identical spike during peak hours.
- Use multiple timeframes: High volume on a 5-minute chart is context-dependent. Check the daily chart to understand whether that volume spike aligns with a key support/resistance level or occurs in the middle of nowhere.
- Do not rely on volume alone: No indicator works in isolation. Volume indicators work best as confirmation tools layered on top of a broader strategy built around trend, structure, and momentum.
So — Do Volume Indicators Actually Work?
Yes, with appropriate expectations. They do not work the same way they do in equities, where true transactional data is available. But tick volume in forex is a reasonable proxy, especially for major pairs during active sessions. When used correctly — as a confirmation and divergence tool rather than a standalone signal generator — volume indicators add a meaningful layer of analysis that pure price-action or indicator-only traders often miss.
The traders who get the most value from volume analysis are those who understand its limitations and use it to answer a specific question: Is there real conviction behind this move? That question is always worth asking, regardless of what market you trade.
If you trade on MetaTrader 4 or 5 and want to integrate volume-based tools into a systematic approach, MGH Products at mghfx.com offers indicators and Expert Advisors designed to help retail traders apply these concepts more consistently and without guesswork.
Disclaimer: This article is for educational purposes only and does not constitute financial or trading advice. Trading forex involves significant risk. Always conduct your own research and consult a qualified financial professional before making trading decisions.
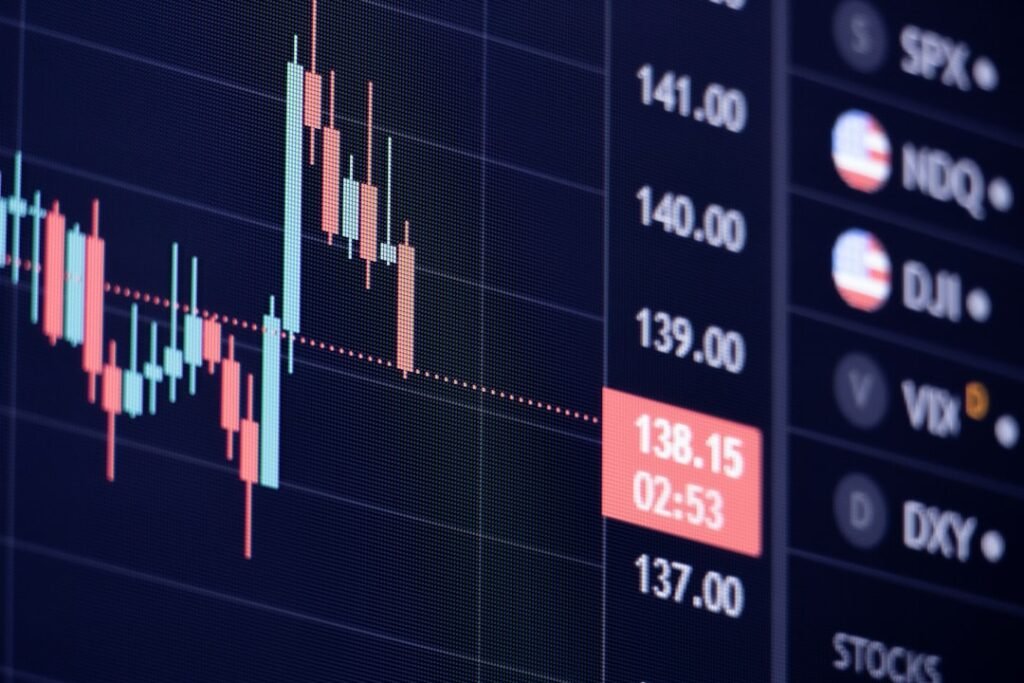
Photo by Tötös Ádám on Unsplash